Download
1 / 8
80 likes | 239 Vues
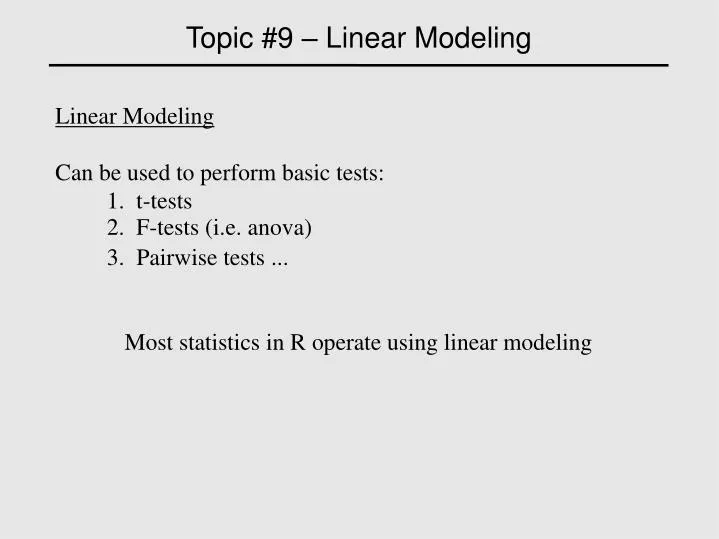
Topic #9 – Linear Modeling . Linear Modeling Can be used to perform basic tests: 1. t-tests 2. F-tests (i.e. anova) 3. Pairwise tests ... Most statistics in R operate using linear modeling. Topic #9 – Linear Modeling . Linear Modeling R uses data frames for linear modeling

E N D
Topic #9 – Linear Modeling Linear Modeling Can be used to perform basic tests: 1. t-tests 2. F-tests (i.e. anova) 3. Pairwise tests ... Most statistics in R operate using linear modeling
Topic #9 – Linear Modeling • Linear Modeling • R uses data frames for linear modeling • They're a named panel of data • Each observational unit is a single row • Each observational variable is a different column
Topic #9 – Linear Modeling • Linear Modeling • R uses data frames for linear modeling • They're a named panel of data • Each observational unit is a single row • Each observational variable is a different column Height=c(61, 63, 70, 68, 67, 72, 70, 66) Gender=factor(c(rep(“F”,4), rep(“M”,4))) Age=c(18, 26, 23, 25, 21, 20, 26, 30) Data=as.data.frame(array(NA,c(8,3))) Data[,1]=Height Data[,2]=Gender Data[,3]=Age dimnames(Data)[[2]]=c(“Height”,”Gender”,”Age”)
Topic #9 – Linear Modeling • Linear Modeling • R model specification is a little confusing • Height ~ 0 + factor(Gender) + Age • Syntax: • 1. +0 or +1 -- specifies whether an intercept is included • 2. factor( ) -- specifies that a variable is categorical • 3. + -- includes a variable • 4. : -- includes the interaction between two variables • 5. * -- includes variables and their interaction • 6. ( )^n -- includes nth level interactions
Topic #9 – Linear Modeling Linear Modeling Can pull out fitted values, residuals, coefficients, etc Can be summarized to show significance of variables LM=lm(Height~ 0 + factor(Gender) + age, data=Data.Frame LM$fitted.values LM$residuals summary(LM)$coefficients summary(LM)
Topic #9 – Linear Modeling Summary output > summary(lm(Height~0+factor(Gender)+Age,data=Data.Frame)) Call: lm(formula = Height ~ 0 + factor(Gender) + Age, data = Data.Frame) Residuals: 1 2 3 4 5 6 7 8 -4.585 -2.449 4.500 2.534 -1.805 3.178 1.280 -2.652 Coefficients: Estimate Std. Error t value Pr(>|t|) factor(Gender) 1 65.89173 9.04178 7.287 0.000761 *** factor(Gender) 2 69.16302 9.51099 7.272 0.000769 *** Age -0.01703 0.38391 -0.044 0.966332 --- Signif. codes: 0 ‘***’ 0.001 ‘**’ 0.01 ‘*’ 0.05 ‘.’ 0.1 ‘ ’ 1 Residual standard error: 3.892 on 5 degrees of freedom Multiple R-squared: 0.9979, Adjusted R-squared: 0.9966 F-statistic: 793.9 on 3 and 5 DF, p-value: 4.090e-07
Topic #9 – Linear Modeling ANOVA Linear modeling can be used as an F-test LM.Full=lm(Height~ 0 + factor(Gender) + age, data=Data.Frame LM.Reduced=lm(Height~ 0 + age, data=Data.Frame anova(LM.Full, LM.Reduced)
Topic #9 – Linear Modeling ANOVA anova output > anova(LM.Full, LM.Reduced) Analysis of Variance Table Model 1: Height ~ 0 + factor(Gender) + Age Model 2: Height ~ 1 + Age Res.Df RSS Df Sum of Sq F Pr(>F) 1 5 75.720 2 6 96.491 -1 -20.771 1.3716 0.2943