Download
1 / 18
290 likes | 1.66k Vues
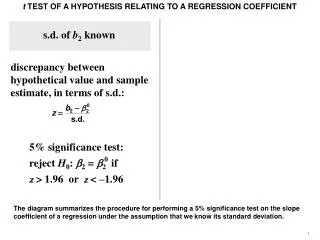
2-Sample z-test; known variances: Summary. Null hypothesis: H 0 : μ 1 – μ 2 = Δ 0 Test statistic: P-values are calculated as before for z tests. β ( Δ ’) Summary. If n 1 (m)= n 2 (n) = n. Example 9.3: Difference, z-test, known σ.

E N D
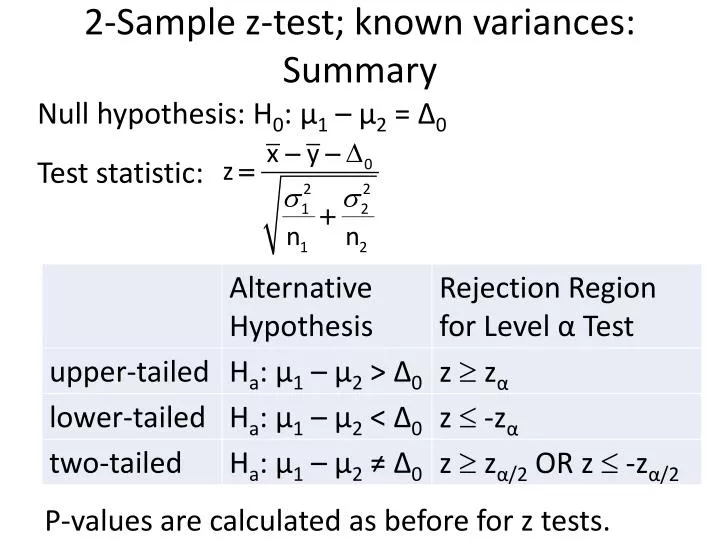
2-Sample z-test; known variances: Summary Null hypothesis: H0: μ1 – μ2 = Δ0 Test statistic: P-values are calculated as before for z tests.
β(Δ’) Summary If n1(m)= n2(n) = n
Example 9.3: Difference, z-test, known σ Yield strengths of cold-rolled steel: n1 = 20, sample average = 29.8 ksi, σ1 = 4.0. Yield strengths for two-sided galvanized steel: n2 = 25, sample average = 34.7 ksi, σ2 = 5.0. Assume that both distributions are normal. Suppose that when the true difference differs by at most 5, we want the probability of detecting that departure to be 0.9. Does the above study with a level 0.01 test satisfy this condition?
β(Δ’) Summary If n1(m)= n2(n) = n
Two-sample t-test round DOWN to the nearest integer
2-Sample t-test: Summary Null hypothesis: H0: μ1 – μ2 = Δ0 Test statistic: P-values are calculated as before for t tests.
Example: Difference, t-test, CI A group of 15 college seniors are selected to participate in a manual dexterity skill test against a group of 20 industrial workers. Skills are assessed by scores obtained on a test taken by both groups. The data is shown in the following table: a) Conduct a hypothesis test to determine whether the industrial workers had better manual dexterity skills than the students at the 0.05 significance level. b) Also construct a 95% confidence interval for this situation.
Paired t-test Example 9.8. Trace metals in drinking water affect the flavor, and unusually high concentrations can pose a health hazard. The following is the results of a study in which six river locations were selected and the zinc concentrations in (mg/L) determined for both surface water and bottom water at each location. The six pairs of observations are displayed graphically below.
Paired t-test: Summary Null hypothesis: H0: μD = Δ0 Test statistic: P-values are calculated as before for t tests.
Example: Paired t test In an effort to determine whether sensitivity training for nurses would improve the quality of nursing provided at an area hospital, the following study was conducted. Eight different nurses were selected and their nursing skills were given a score from 1 to 10. After this initial screening, a training program was administered, and then the same nurses were rated again. On the next slide is a table of their pre- and post-training scores.
Example: Paired t-test • Conduct a test to determine whether the training could on average improve the quality of nursing provided in the population at a significance level of 0.05. • What is the 95% confidence interval of the population mean difference in nursing scores?
2-Sample z-test; large sample, proportions: Summary Null hypothesis: H0: p1 – p2 = 0 Test statistic: P-values are calculated as before for z tests.
Example: Large Sample Proportion Test Two TV commercials are developed for marketing a new product. A volunteer test sample of 200 people is randomly split into two groups of 100 each. In a controlled setting, Group A watches commercial A and Group B watches commercial B. In Group A, 25 say they would buy the product, in Group B, 20 say they would buy the product. The marketing manager who devised this experiment concludes that commercial A is better. Do you agree or disagree with the marketing manager at a significance level of 0.05?
n for large sample proportions If n1 = n2, level α test, type II error probability β, with alternative values p1 and p2 and p1 – p2 = d for one-tailed test Replace zα with zα/2 for a two-tailed test.
Example: Large Sample Proportion Test Two TV commercials are developed for marketing a new product. A volunteer test sample of 200 people is randomly split into two groups of 100 each. In a controlled setting, Group A watches commercial A and Group B watches commercial B. In Group A, 25 say they would buy the product, in Group B, 20 say they would buy the product. What is the 95% confidence interval for the buying of the product for Group A and Group B?