Download
1 / 20
220 likes | 417 Vues
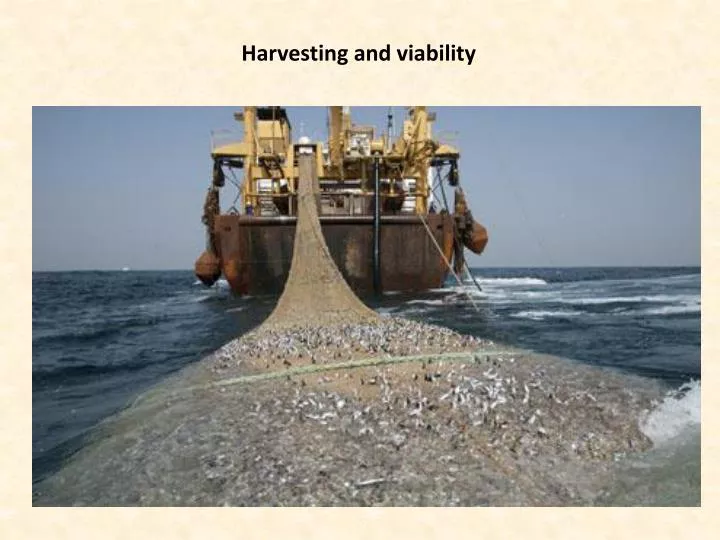
Harvesting and viability. Harvesting ecology. The birth-immigration-death-emigration approach (BIDE). Basic questions are:. How does population size change after harvesting? How stable are harvested poplations? How much harvesting is save? How to predict future stock population size?

E N D
Harvesting ecology The birth-immigration-death-emigration approach (BIDE) Basic questions are: • How does population size change after harvesting? • How stable are harvested poplations? • How much harvesting is save? • How to predict future stock population size? • What is the minimal size of a population to survive? • What is the maximum sustainable yield
Maximum sustainable yield The continuous Pearl – Verhulst logistic growth model The maximum sustainable yield is the largest catch that can be taken from a fishery stock over an indefinite period. K Carrying capacity At K/2 a population growths fastest. This is the point of maximum sustainable yield. K/2 Optimum sustainable yield Min Minimum viable population size
The classical constant harvesting model of fisheries Pearl – Verhulst logistic growth model Population increase is reduced by a constant amount m. The stationary point is given by: Under constant harvesting a population is only stable if the reproduction rate r is larger than 4m/k This is a necessary but not a sufficient condition.
The effect of constant harvesting r = 2.6; K = 1000; m = 200 r = 2.6; K = 1000; m = 0 Constant harvesting below the extinction threshold tends to stabilize populations. r = 2.6; K = 1000; m = 240 4m/K = 0.96 Even below the 4m/K threshold populations might go extinct.
Going Excel The discrete form of logisticgrowth
The effect of proportional harvesting r = 2.6; K = 1000; f = 0 Proportionality term r = 2.6; K = 1000; f = 0.7 Under proportional harvesting a population is only stable if the harvesting rate is smaller than the reproduction rate This is a necessary but not a sufficient condition. Proportional harvesting might also stabilize populations.
The influence of noise (stochasticenvironmentalfluctuations) We model stochasticfluctuations by anadditionalnoise term
r = 1.8; K = 1000; f = 2.5; noise = 50 r = 1.8; K = 1000; f = 2.5; noise = 0 Environmental stochasticity allows populations to survive even under severe harvesting. r = 2.6; K = 1000; f = 2.5; noise = 50 r = 2.6; K = 1000; f = 2.5; noise = 0 Noise might also destabilize populations
The problem of recruitment How to estimate the intrinsic reproduction rate r, that is the proportion of fish reaching reproductive age. r varies from year to year. We use long term abundance data to estimate r.
The continuous form of the growth function First order quadratic differential equation N0=1, K>>1 The generalized logistic growth model Applications: Cancer cell growth (b→0) -1 b→0 Gompertz growth function Human demography Industrial growth processes The parameter b describes the degree of asymmetry around the inflection point.
The Gompertz model is not symmetric around the inflection point. A high degree of asymmetry destabilizes populations =2.8 b=1.07 =2.8 b=0.8 =2.8 b=1
The application of simple population models in fisheries Harvesting control rule Stock overfishing is a biological overfishing and occurs at a negative fish growth rate Safe fishing Fleet over-fishing Spawning biomass Buffer Fleet overfishing includes the economic aspect and occurs when proft of fishering decreases Stock overfishing Mortality due to fishery = 2.9 K = 500 Thediscrete Ricker model of fisheries is a special case of the Gompertz model and is the standard model of stock forecasting in the EU This linear function can easily be solved for r and K.
The Ricker model of fisheries is the discrete counterpart of the continuous logistic model r = 2.0; K = 1000; noise = 0 The Ricker model with proportional harvesting r = 2.0; K = 1000; f = 0.7; noise = 200 r = 2.0; K = 1000; noise = 200 Proportional harvesting predicts equilibrium population sizes below the carrying capacities.
Overfishing of atlantic cod at the East coast of New Foundland Population collapse in 1992 Garus morhua Growth overfishing occurs when fish are harvested at an average size that is smaller than the size that would produce the maximum yield. Recruitment overfishing occurs when the mature adult population is depleted to a level where it no longer has the reproductive capacity to replenish itself.Ecosystem overfishing occurs when the functioning of the ecological system is altered by overfishing.
Population bottlenecks Population bottleneck Population size Survival Extinction Time Bottlenecks are sharp declines in population size • Population bottlenecks might have population consequences • Populations might become too small for successful mating and reproduction • Populations might becomes depressed by inbreeding causing reduced fitness • Populations might become vulnerable to infectuous diseases • Populations might be less able to cope with local habitat changes
Minimum viable populations MVPs define the lower bound of population size such that it can survive under natural conditions. MVP are assessed by viability analysis The first viability analysis was proposed by Shaffer in 1978 for Yellowstone grizzlys. http://www.vortex9.org/vortex.html
Viability analyses of K-strategists The minimum viable population refer to the population size necessary to ensure between 90 and 95% probability of survival between 100 to 1,000 years into the future. Minimum viable population size is necessary to ensure long term positive population growth: R > 1 Leslie matrix approach We reduce initial population sizes until the population dies out. In thisexample the population survives The second year population dies out in the second year. The whole population survives.
Persistence times and viability analysis in r strategists Persistence times increase with population size and decrease with reproductive stochasticity r > s2(r) What is the probability that a population dies out? Persistence time r < s2(r) Population size If the population is not density regulated the average persistence time is finally extinct finally surviving Persistence times of Scandinavian Metrioptera grashoppers (Berggren 2001) Orb web spiders on Bahama islands (Schoener 1992)
r is calculated at times, where population sizes increase. generations Absolute population sizes Annual extinction probability The deciding factor in viability analysis is the variance /mean ratio of the reproduction rate. The higher the variance /mean ratio is, the higher is the probability of extinction. The higher the reproduction rate is, the higher is also the probability of extinction. The carrying capacity is of minor importance for persistence times. Typical arthropod species survive locally a few to a few tens of generations. Most species do not have stable populations.