Download
1 / 1
10 likes | 114 Vues
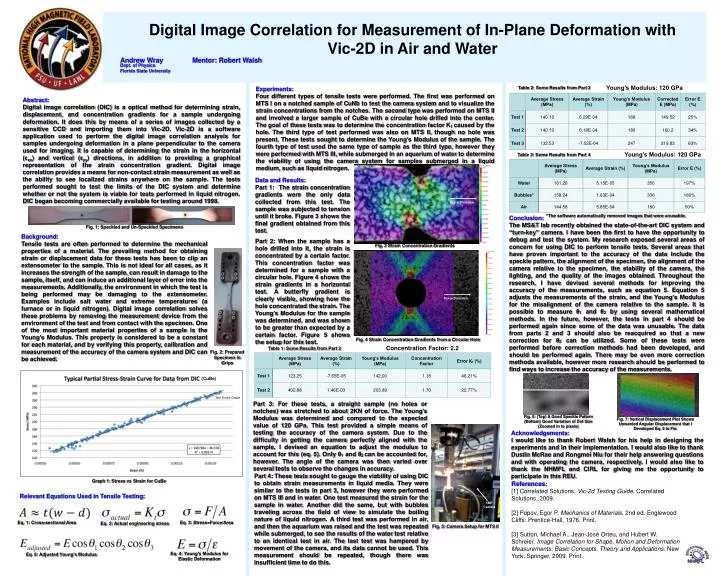
Digital Image Correlation for Measurement of In-Plane Deformation with Vic-2D in Air and Water. Andrew Wray Mentor: Robert Walsh Dept. of Physics Florida State University. Young’s Modulus: 120 GPa. Experiments:

E N D
Digital Image Correlation for Measurement of In-Plane Deformation with Vic-2D in Air and Water Andrew Wray Mentor: Robert Walsh Dept. of Physics Florida State University Young’s Modulus: 120 GPa Experiments: Four different types of tensile tests were performed. The first was performed on MTS I on a notched sample of CuNb to test the camera system and to visualize the strain concentrations from the notches. The second type was performed on MTS II and involved a larger sample of CuBe with a circular hole drilled into the center. The goal of these tests was to determine the concentration factor Kt caused by the hole. The third type of test performed was also on MTS II, though no hole was present. These tests sought to determine the Young’s Modulus of the sample. The fourth type of test used the same type of sample as the third type, however they were performed with MTS III, while submerged in an aquarium of water to determine the viability of using the camera system for samples submerged in a liquid medium, such as liquid nitrogen. Table 2: Some Results from Part 3 Abstract: Digital image correlation (DIC) is a optical method for determining strain, displacement, and concentration gradients for a sample undergoing deformation. It does this by means of a series of images collected by a sensitive CCD and importing them into Vic-2D. Vic-2D is a software application used to perform the digital image correlation analysis for samples undergoing deformation in a plane perpendicular to the camera used for imaging. It is capable of determining the strain in the horizontal (εxx) and vertical (εyy) directions, in addition to providing a graphical representation of the strain concentration gradient. Digital image correlation provides a means for non-contact strain measurement as well as the ability to see localized strains anywhere on the sample. The tests performed sought to test the limits of the DIC system and determine whether or not the system is viable for tests performed in liquid nitrogen. DIC began becoming commercially available for testing around 1998. Young’s Modulus: 120 GPa Table 3: Some Results from Part 4 Data and Results: Part 1: The strain concentration gradients were the only data collected from this test. The sample was subjected to tension until it broke. Figure 3 shows the final gradient obtained from this test. Force Direction *The software automatically removed images that were unusable. Conclusion: The MS&T lab recently obtained the state-of-the-art DIC system and “turn-key” camera. I have been the first to have the opportunity to debug and test the system. My research exposed several areas of concern for using DIC to perform tensile tests. Several areas that have proven important to the accuracy of the data include the speckle pattern, the alignment of the specimen, the alignment of the camera relative to the specimen, the stability of the camera, the lighting, and the quality of the images obtained. Throughout the research, I have devised several methods for improving the accuracy of the measurements, such as equation 5. Equation 5 adjusts the measurements of the strain, and the Young’s Modulus for the misalignment of the camera relative to the sample. It is possible to measure θ1 and θ2 by using several mathematical methods. In the future, however, the tests in part 4 should be performed again since some of the data was unusable. The data from parts 2 and 3 should also be reacquired so that a new correction for θ2 can be utilized. Some of these tests were performed before correction methods had been developed, and should be performed again. There may be even more correction methods available, however more research should be performed to find ways to increase the accuracy of the measurements. Fig. 1: Speckled and Un-Speckled Specimens Background: Tensile tests are often performed to determine the mechanical properties of a material. The prevailing method for obtaining strain or displacement data for these tests has been to clip an extensometer to the sample. This is not ideal for all cases, as it increases the strength of the sample, can result in damage to the sample, itself, and can induce an additional layer of error into the measurements. Additionally, the environment in which the test is being performed may be damaging to the extensometer. Examples include salt water and extreme temperatures (a furnace or in liquid nitrogen). Digital image correlation solves these problems by removing the measurement device from the environment of the test and from contact with the specimen. One of the most important material properties of a sample is the Young’s Modulus. This property is considered to be a constant for each material, and by verifying this property, calibration and measurement of the accuracy of the camera system and DIC can be achieved. Part 2: When the sample has a hole drilled into it, the strain is concentrated by a certain factor. This concentration factor was determined for a sample with a circular hole. Figure 4 shows the strain gradients in a horizontal test. A butterfly gradient is clearly visible, showing how the hole concentrated the strain. The Young’s Modulus for the sample was determined, and was shown to be greater than expected by a certain factor. Figure 5 shows the setup for this test. Fig. 3 Strain Concentration Gradients Force Direction Fig. 4 Strain Concentration Gradients from a Circular Hole Concentration Factor: 2.2 Table 1: Some Results from Part 2 Fig. 2: Prepared Specimen in Grips (CuBe) *Not Entire Graph Part 3: For these tests, a straight sample (no holes or notches) was stretched to about 2KN of force. The Young’s Modulus was determined and compared to the expected value of 120 GPa. This test provided a simple means of testing the accuracy of the camera system. Due to the difficulty in getting the camera perfectly aligned with the sample, I devised an equation to adjust the modulus to account for this (eq. 5). Only θ1 and θ2 can be accounted for, however. The angle of the camera was then varied over several tests to observe the changes in accuracy. Fig. 6: (Top) A Good Speckle Pattern (Bottom) Good Variation of Dot Size (Zoomed in to pixels) Fig. 7: Vertical Displacement Plot Shows Unwanted Angular Displacement that I Developed Eq. 5 to Fix. Acknowledgements: I would like to thank Robert Walsh for his help in designing the experiments and in their implementation. I would also like to thank Dustin McRae and Rongmei Niu for their help answering questions and with operating the camera, respectively. I would also like to thank the NHMFL and CIRL for giving me the opportunity to participate in this REU. Part 4: These tests sought to gauge the viability of using DIC to obtain strain measurements in liquid media. They were similar to the tests in part 3, however they were performed on MTS III and in water. One test measured the strain for the sample in water. Another did the same, but with bubbles traveling across the field of view to simulate the boiling nature of liquid nitrogen. A third test was performed in air, and then the aquarium was raised and the test was repeated while submerged, to see the results of the water test relative to an identical test in air. The last test was hampered by movement of the camera, and its data cannot be used. This measurement should be repeated, though there was insufficient time to do this. Graph 1: Stress vs Strain for CuBe References: [1] Correlated Solutions. Vic-2d Testing Guide. Correlated Solutions, 2009. [2] Popov, Egor P. Mechanics of Materials. 2nd ed. Englewood Cliffs: Prentice-Hall, 1976. Print. [3] Sutton, Michael A., Jean-José Orteu, and Hubert W. Schreier. Image Correlation for Shape, Motion and Deformation Measurements: Basic Concepts, Theory and Applications. New York: Springer, 2009. Print. Relevant Equations Used in Tensile Testing: 5MP Camera Eq. 1: Cross-sectional Area Eq. 3: Stress=Force/Area Eq. 2: Actual engineering stress Fig. 5: Camera Setup for MTS II Eq. 4: Young’s Modulus for Elastic Deformation Eq. 5: Adjusted Young’s Modulus