Download
1 / 33
330 likes | 480 Vues
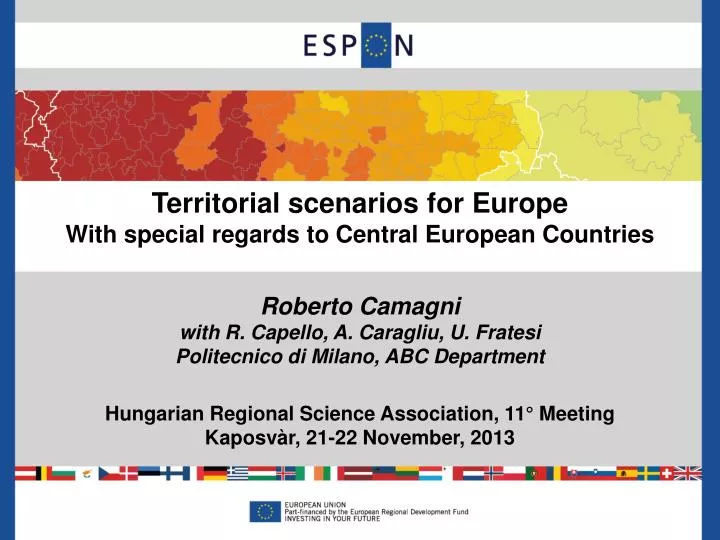
Territorial scenarios for Europe With special regards to Central European Countries Roberto Camagni with R. Capello, A. Caragliu , U. Fratesi Politecnico di Milano, ABC Department. Hungarian Regional Science Association , 11° Meeting Kaposvàr , 21-22 November , 2013.

E N D
Territorial scenarios for Europe With special regards to Central European Countries Roberto Camagni with R. Capello, A. Caragliu, U. Fratesi Politecnico di Milano, ABC Department HungarianRegional Science Association, 11° Meeting Kaposvàr, 21-22 November, 2013
Objectivesof the presentation Topresentresultsof some researchworkscarried out within the ESPON Programmeof the EU, namely: • ET2050: developmentscenariosforEuropeanRegions (2013) • KIT: Knowledge, Innovation and Territory (2011-12) • Span: SpatialScenariosfor the Latin ArcCountries (2008-09) To produce “quantitative foresights” (notforecasts)based on conditional scenario assumptionsforallEuropeanregions up to 2030, withspecialreferencetoCentralEasternCountries Topresent some earlyreflections on developmentpolicies
Introduction Over the last few years, the world economy has gone through a severe period of economic downturn, the worst since the end of the second world war. If the overall magnitude of the effects generated by the crisis is not yet fully understood, even less clear is the spatial distribution of these effects. This explains the importance of the use of macroeconomic regional econometric and forecasting models.
Introduction Regions belong to different nations with different exposure to the crisis. Regions have different industrial specialization, as well as different capacities to exploit untapped resources, or territorial capital assets. Macroeconomic demand side effects have different impacts : - on national economies, according to their different level of public debt and deficit, and development potential, • on the different regions, according to their consumption patterns, type of demand (public vs. private) and productive specializations. • Financial speculation determined a differentiated rise in the spread on public bonds in different countries, exacerbating the cost of the debt service, raising public deficits, generating huge effects on public spending at central and local levels.
Introduction • A strong control on public expenditure and on its reduction was imposed by the EU, especially to “vicious” countries. The effects of such a reduction are expected to be stronger in those regions with a higher share of public demand with respect to the private one, being generally the poorer and less productive regions; • in “vicious” countries, private investments decreased as a consequence of the increase in interest rates, penalizing private actors, and particularly productive regions; • a credit crunch came as a consequence of the financial intermediaries’ decision to prefer financial investments on public bonds, when guarantees existed on sovereign default; the real sector and the most productive regions hosting it were once again penalized more than others. • In general though, is difficult to predict which regions were hit more.
The foresighttool: the MASST3 model MASST isaneconometricforecastingmodel.Previousversionsof MASST developedfor ESPON 3.2; ESPON SPAN; DGRegioprojects. The ET2050 project isbased on a newversionof MASST, considering the economiccrisis (twoperiodsofmodelestimation), public budget constraints, innovationmodes, the roleofurbanareas in regionalgrowth. The modelisableto simulate effects on regionalgrowthof: • the economiccrisis; • macroeconomicelements (public budget constraints, sovereigndebt, spread in interest ratesof public bonds, exchangerates); • territorial capital elements (innovativeness, trust, accessibility); • cohesion and infastructurepolicies.
The model • The logicsof the modelis at the sametimeTop-down & Bottom-up (i.e. distributive and generative): • nationalgrowth (determinedbymacro-economicelements: demand side) isdistributedamongregions, • butregionsadd a “differential” effect (determinedbypresenceofterritorial capital: supply side) ableto feed-back on national performance. • Quantitative foresightisproducedforall NUTS2 regionsofall 27 EU countries (270 regions).
ScenarioAssumptions • structural breaks brought in by the crisis are considered, due to emerging global contradictions: • Stop to demand based on debt in advanced countries, • Financialization of western economies and related risks, • China and BRICs supporting western real income (through low-price exports) and financing the trade deficit of USA : persisting? By consequence, in the future: • the balance of the geo-political game will be different; • winning assets will be different; • spread in interest rates proportional to sovereign debts; • necessary (but probably too high) austerity measures imposed on public deficits by the EU.
Scenario Assumptions • b) “Regionalized” globalization, with the large “triad” areas (Europe, America, East and South Asia) more independent and more internally integrated • BRICs enter progressively in the medium and high technology game • - The growth of real income in Europe will be more modest; • - “Regionalized” globalization processes will enable the recovery of manufacturing activities in Europe (and the US); • A number of new technologies will develop: nanotech, biotech, transporttechnologies, newmaterials c) More importantly: a newparadigmwill emerge: the “green economy”, due to increasing energy prices and growing concern about climate change.Manysectorstouched: manufacturing, energy, transport, building and construction, tourism, agriculture (zero-km) Provides a newdemand source, newjobs and a reduction in dependency on fossilfuels Itmayboost a revival ofendogenousgrowth in Europe
Scenario Assumptions d) Regional disparities are likely to increase (two speed growth) • Metro regions will host the advanced activities and R&D • New manufacturing activities, benefiting from technological progress, will also locate in metro and second rank cities e) Austerity measures will endanger growth in “vicious” , mainly southern European countries: for some times, “internal devaluations”, severe cuts in public spending and difficulties in financing private investments will determine a cumulative divergence with respect to stronger countries. All these elements can be easily accomodated into the MASST model, thanks to the new inclusion of sectoral regional structures and constraints coming from national sovereign debt and public budget disequilibria.
Scenario Assumptions Concerning Central - Eastern European Countries: • Catching up in productivity with respect to Old 15 Countries will continue, but possibly at a lower rate due to: • FDI dependency: they will slowly redirect towards outer eastern countries and towards trade and commercial functions, in order to benefit from increasing internal incomes (in CEECs), • Difficulty in keeping low levels of inflation, due to difficulty in keeping wage increases in line with productivity increases, • Outflows of profits by multinational companies, • Slow taking-off of an endogenous accumulation of capital. • ii) Difficulty in finding a more advanced innovation “pattern” with respect to the present one (mainly an “imitative innovation pattern”, driven by FDI, with an internal dualist industrial structure).
Trends in competitiveness Real Effective Exchange rates for the NMS, 1994-2012
Assumptionsof the Baseline Scenario - the socio-economic and demographic trends of the past will continue, and no major change will come to alter the EU economy; • economic policies will remain the present ones; • a general slow economic recovery will start in 2016; • a slight increase in competitiveness of European countries is assumed in 2030; • By 2030 interest rates on bonds will return back to lower, pre-crisis values, thanks to the end of strong speculation; • the stabilitypactremains the same, stillimposinghighly restrictive public budget policies.
RESULTS FOR THE • BASELINE SCENARIO • (2030)
Aggregate results of the Baseline scenario 1. The New12 countries grow a little more than the Western countries. 2. New12 countriesincreaseemployment in services more than in manufacturing, entering a new stage ofdevelopment. 3. Western countries have a balanced growth between manufacturing and services.
Baseline: annual average GDP growth rate Two speed Europe; Southern peripheral countries grow less than Northern countries. Southern European countries discount the difficult present conditions on their future evolutionary trajectories. Eastern European countries still grow more than the EU 15, but this is not enough to catch up the GDP per capita levels of the Western countries in 2030. Overall intra-national regional disparities increase.
Theil index in the Baseline scenario Total regionaldisparities Inter-nationaldisparities Intra-nationaldisparities
EXPLORATORY SCENARIOS • (2030)
Summary of assumptions for the exploratory scenarios “Megas” scenario Market driven scenario; welfare system fullyprivatized; financialdebtrepaid in 2030; budget reducedforcohesionpolicies; concentrationofinvestments in Europeanlargecities. “Cities” scenario Public policiesmostly at nationallevel; actual welfare system reinforcedthroughincreasedtaxation; financialdebtnotfullyrepaid in 2050; budget maintainedforcohesionpolicies; concentrationofinvestments in secondrankcities. “Regions” scenario Social policies; strong public welfare system; financialdebtrepaid in 2050; budget significantlyincreasedforcohesionpolicies; concentrationofinvestments in rural and cohesionareas.
Aggregate GDP growth results for the exploratory scenarios 1. The “Cities scenario” is the mostexpansionary: territorial capital and the urban system are betterexploitedthan in the otherscenarios. 2. This holds also for New 12 countries. 3. New 12 countries are those that gain in the regions scenario with respect to the baseline.
GDP growth rates in the Megas scenario: differences with respect to the baseline • In Western countries: • strong advantagestorich and centralregions; • ruralareasofrichregionsgainrelativelyless; • relativelypoorcountries (likeGreece) take advantageof a generalincrease in demand. • In Easterncountries: • - relatively more diffusedgrowth, thanksto a generalrecoveryof the EU economy.
GDP growth rates in the Cities scenario: differences with respect to the baseline • In Western countries: • more widespread and diffused growth at intranational level; • strong countries like Germany, the Netherlands, Austria, increase less than Southern countries (catching-up). • In Eastern countries: • diffused advantages, relatively less pronounced than in Western; • similar increase in growth than in the megas scenario.
GDP growth rates in the Regions scenario: differences with respect to the baseline Central/core regions grow less than in the baseline scenario. Rural or peripheral areas gain relatively more than in the baseline scenario. This holds for both Western and Eastern countries.
A sensitivityanalysis on disparities Severalanalyses on sensitivityof total disparitiesweretomacro-economicassumptions in the baseline scenario wererun. The mostrelevant and interesting: Removing the assumptionof a persistenceofhigherinflationrates in CEECswithrespectto western countries, a higher GDP performance appears in CEECs (mainly due tohigherexports and lowerimports) and byconsequence a muchlowerincrease in total regionaldisparities in 2030.
Conclusions • Difficulttimesaheadforinter-regionaldisparities (due tocentralizationtrends, macroeconomicconstraints), confirmedby the recent DG Regio “webminar” 2. A scenario supporting “cities” (first, second and possiblythirdrankcities) looks the mostdesirable: in termsofgrowthpotential (best useof “concentrateddiffusion” ofterritorial capital) and in termsofterritorialcohesion • Relevant policy tasksforCEECs: • keepwage and price increases in linewithproductivitygrowth • launch a waveofendogenous capital accumulation • Find a new “innovation pattern”, based on a “smart” specialization and on selectedinter-regionalcooperations.
THANK YOU VERY MUCH FOR YOUR ATTENTION!