Download
1 / 32
370 likes | 776 Vues
NASA instruments. Airborne Visible InfraRed Imaging Spectrometer. Imaging Spectroscopy. Imaging Spectroscopy is the acquisition of images where for each spatial resolution element in the image a spectrum of the energy arriving at the sensor is measured.

E N D
NASA instruments Airborne Visible InfraRed Imaging Spectrometer
Imaging Spectroscopy • Imaging Spectroscopy is the acquisition of images where for each spatial resolution element in the image a spectrum of the energy arriving at the sensor is measured. • These spectra are used to derive information based on the signature of the interaction of matter and energy expressed in the spectrum. • This spectroscopic approach has been used in the laboratory and in astronomy for more than 100 years.
Hyperspectral vs multispectral spectrometers • Multipscetral spectrometers have a limited number of spectral bands to operate with (7-64). • Using hyperspectral data (about two hundred bands) • minerals on the Earth's surface can be identified and new mineral maps can be created to select sites for exploration; • forest inventories can be developed for remote regions to support ecological planning and management. • vegetation monitoring can be done for agriculture
AVIRIS • It is a unique optical sensor that delivers calibrated images of the upwelling spectral radiance in 224 contiguous spectral channels (bands) with wavelengths from 400 to 2500 nanometers. • AVIRIS has been flown on two aircraft platforms: • NASA ER-2 jet and • Twin Otter turboprop. • AVIRIS has flown North America, Europe, portions of South America, and most recently, Argentina.
ER-2 • The ER-2 is a U2 aircraft modified for increased performance which flies at approximately 20 km above sea level, at about 730 km/hr.
ER-2: High Altitude Airborne Science Program • NASA is using two ER-2 Airborne Science aircrafts as flying laboratories. • The aircraft, based at NASA's Dryden Flight Research Center, Edwards, Calif. • Collects information about Earth resources, celestial observations, atmospheric chemistry and dynamics, and oceanic processes. • The aircraft is used for electronic sensor research and development, satellite calibration, and satellite data validation.
Twin Otter • flies at 4km above ground level at 130km/hr.
AVIRIS Objective • Identify, measure, and monitor constituents of the Earth's surface and atmosphere based on molecular absorption and particle scattering signatures. • Research with AVIRIS data is predominantly focused on understanding processes related to the global environment and climate change.
AVIRIS Concept • Contains 224 different detectors, each with a wavelength sensitive range (also known as spectral bandwidth) of approximately 10 nanometers (nm); • Covers the entire range between 380 nm and 2500 nm. • When the data from each detector is plotted on a graph, it yields a spectrum. • Comparing the resulting spectrum with those of known substances reveals information about the composition of the area being viewed by the instrument.
AVIRIS Concept • AVIRIS uses a scanning mirror to sweep back and forth ("whisk broom" fashion), producing 614 pixels for the 224 detectors each scan. • The pixel size and swath width of the AVIRIS data depend on the altitude from which the data is collected. • When collected by the ER-2 each pixel produced by the instrument covers an area approximately 20 meters square on the ground (with some overlap between pixels), thus yielding a ground swath about 11 kilometers wide. • When collected by the Twin Otter,each ground pixel is 4m square, and the swath is 2km wide.
AVIRIS Concept • The ground data is recorded on board the instrument along with navigation and engineering data and the readings from the AVIRIS on-board calibrator. • When all of this data is processed and stored on the ground, it yields approximately 140 Megabytes (MB) for every 512 scans (or lines) of data. Each 512 line set of data is called a "scene", and corresponds to an area about 10km long on the ground.
AVIRIS Concept • Every time AVIRIS flies, the instrument takes several "runs" of data (also known as "flight lines"). AVIRIS tapes have had from one to fifteen runs on them, with each run having anywhere from one to almost forty scenes. • A full AVIRIS tape can yield about 16 Gigabytes (GB) of data per day.
Instrument • 17 Mbps data rate through 1994 • 20.4 Mbps from 1995 • 10 bit data encoding through 1994, 12 bit from 1995 • Silicon (Si) detectors for the visible range, and indium-antimonide (InSb) detectors for the near infrared • "Whisk broom" scanning- 12 Hz scanning rate- Liquid Nitrogen (LN2) cooled detectors- 10 nm nominal channel bandwidth, calibrated to within 1 nm • 30 degrees total field of view (full 614 samples)- 1 milliradian Instantaneous Field Of View (IFOV, one sample), calibrated to within 0.1 mrad • 35GB DLT tape IV recording medium
One pixel response The x-axis is channel wavelength in micrometers, also known as microns (one micron = 1000 nm). The y-axis is radiance, usually expressed in units of microwatts per square centimeter per nanometer per steradian, or uW / (cm^2 * nm * sr).
One pixel response • The general shape of an AVIRIS spectrum is dominated by the light curve of the Sun and the absorption features of the atmosphere. • The Sun has a "blackbody" curve, which in the case of the Sun peaks in the green wavelengths and diminishes at higher and lower wavelengths. The atmosphere absorbs light at wavelengths that correspond to the absorption wavelengths of the atmosphere's components: nitrogen, oxygen, carbon dioxide, water, and other elements. • For example, the deep valleys that go down to near zero around 1.4 and 1.9 microns are due to water absorbing those wavelengths.
Meaning • The peaks and valleys of a spectrum not due to the Sun or the atmosphere reveal information about the chemical composition of the pixel being examined. • Every substance has its own spectrum, even living things. • Green plants, for example, use chlorophyll to absorb the visible light from the sun, but reflect the infrared radiation. • This manifests as a large jump in the spectra in the area where the red light (0.7 microns) merges into the infrared.
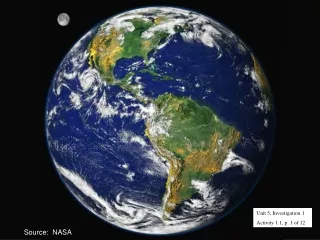
Moffett Field, California, at the southern end of the San Francisco Bay. AVIRIS acquired the data on August 20, 1992 when it was flown on a NASA ER-2 plane at an altitude of 20,000 meters (65,000 feet) over
Moffett Field The top of the cube is a false-color image made to accentuate the structure in the water and evaporation ponds on the right. Also visible on the top of the cube is the Moffett Field airport.
Moffett Field • The sides of the cube are slices showing the edges of the top in all 224 of the AVIRIS spectral channels. • The tops of the sides are in the visible part of the spectrum (wavelength of 400 nanometers), and the bottoms are in the infrared (2,500 nanometers). The sides are pseudo-color, ranging from black and blue (low response) to red (high response).
Moffett Field • Of particular interest is the small region of high response in the upper right corner of the larger side. • This response is in the red part of the visible spectrum (about 700 nanometers), and is due to the presence of 1-centimeter-long (half-inch) red brine shrimp in the evaporation pond.
Free data • AVIRIS DATA http://aviris.jpl.nasa.gov/html/aviris.freedata.html • Landsat 7 ETM+ http://landsat.usgs.gov/sampleproducts.php
HYPERION: Space born data • The Hyperion instrument provides a new class of Earth observation data for improved Earth surface characterization. • The Hyperion provides a high resolution hyperspectral imager capable of resolving 220 spectral bands (from 0.4 to 2.5 µm) with a 30 meter spatial resolution. • The instrument images a 7.5 km by 100 km land area per image • Through these large number of spectral bands, complex land eco-systems shall be imaged and accurately classified
Hyperion • Hyperion is NASA's first hyperspectral imager to become operational on-orbit. • Launched aboard NASA's Earth Observing-1 (EO-1) spacecraft, the TRW Inc.-built Hyperion hyperspectral imager is transmitting images of the Earth's surface to ground stations around the world. • The detailed classification of complex land ecosystems with hyperspectral imagery is expected to increase the accuracy of remote sensing data in applications including mining, geology, forestry, agriculture and environmental management.
EO-1 • EO-1 is the first satellite in NASA's New Millennium Program (NMP) Earth Observing series. • NMP is an initiative to demonstrate advanced technologies and designs that show promise for dramatically reducing the cost and improving the quality of instruments and spacecraft for future space missions. • EO-1's primary focus is on developing and testing instruments that are smaller, less expensive and more capable than existing instruments.
Resources • Imaging spectrometers http://www.geo.unizh.ch/~schaep/research/apex/is_list.html
Enhanced Thematic Mapper Plus (ETM +) • is a multispectral scanning radiometer that is carried on board the Landsat 7 satellite. • The sensor has provided nearly continuous acquisitions since July 1999, with a 16-day repeat cycle. • The ETM+ instrument provides image data from eight spectral bands (band designations). • The spatial resolution is 30 meters for the visible and near-infrared (bands 1-5 and 7). Resolution for the panchromatic (band 8) is 15 meters, and the thermal infrared (band 6) is 60 meters. The approximate scene size is 170 x 183 kilometers (106 x 115 miles).
Problem • Over the past decade, the data storage quantity has gone from less than one Gbit to 500 Gbits. • For space missions, the dense memory devices such as DRAM (Dynamic Random Access Memory) are of interest. However, they consume more power, than their static counterparts. • Downlink technologies create a bottleneck for remote sensing missions. • Ten out of 100 minutes of orbit are only given to downlink data for EO-1. Current EO-1 links carries 150 Mbps. Next generation downlink systems are expected to achieve 350 Mbps per link . • With these technology trends, amounts of data are still overrunning capabilities of on-board storage and bandwidths.