Download
1 / 61
630 likes | 1.52k Vues
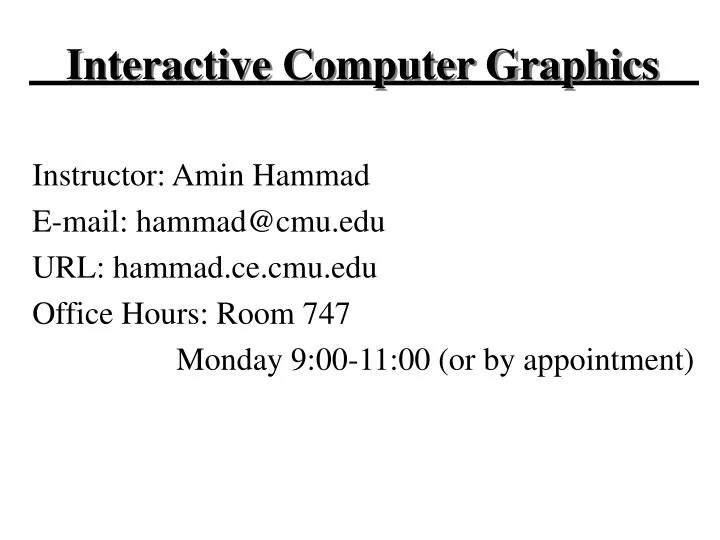
Interactive Computer Graphics Instructor: Amin Hammad E-mail: hammad@cmu.edu URL: hammad.ce.cmu.edu Office Hours: Room 747 Monday 9:00-11:00 (or by appointment) Administrivia of Course Website (hammad.ce.cmu.edu) TA: Cholyeun Hongpisanwiwat cholyeun@sis.pitt.edu

E N D
Interactive Computer Graphics Instructor: Amin Hammad E-mail: hammad@cmu.edu URL: hammad.ce.cmu.edu Office Hours: Room 747 Monday 9:00-11:00 (or by appointment)
Administrivia of Course • Website (hammad.ce.cmu.edu) • TA: Cholyeun Hongpisanwiwat cholyeun@sis.pitt.edu • Office Hours: Monday 9:00-11:00 (or by appointment) • Book: Interactive Computer Graphics (Edward Angel) • Collaboration Policy • Grading: Assignments (45%) + Tests (40%) + Quizzes (15%) • Difficulty/Time required • Programming environment (mainly Visual C++) • Questions?
What is Computer Graphics? • Anything to do with visual representations on a computer, including • Text (e.g. Japanese characters 大学) • GUIs • Computer Images • 3D Graphics: CG special effects, games, animations • Scientific Visualization • Algorithms, theory (physics, math, computation) • Display devices, hardware (graphics cards, monitors)
Course Outline • Graphics Systems and Models • Graphics Programming • Input and Interaction • Geometric Objects and Transformation • Viewing • Shading • Advanced Topics (Object-oriented graphics, texture mapping, curves, etc.)
Contents • General Overview: History and applications of CG • Graphics Systems • Colors Perception • Computer Colors: RGB and HSL • OpenGL Introduction • Some CG demos. Reading: Angel 1, 2.4
Historical Background: Sketchpad • Ivan Sutherland, 1963, MIT: “Sketchpad: A man machine Graphical communications system” (first interactive graphics thesis, included many GUI concepts) Inspired many early graphics researchers • Sutherland also pioneered VR and hidden surface problems • 1988 Turing award “for his pioneering and visionary contributions to computer graphics, starting with sketchpad…”
From Text to GUIs • Xerox Star: First workstation with GUI • Invented at PARC in 1975. Used in the Apple Macintosh, and now MS Windows. Xerox Star Windows 1.0
Graphical applications • Presentations (bar charts, graphs, Powerpoint) • Scientific Visualization Compressible flow around Space shuttle science.gmu.edu
3D Graphics • Maybe what we generally consider CG • Currently important in • Design (CAD) • Education, Simulators, VR • Games • Entertainment (Movies), Art
Effects needed for Realism • Shadows • Reflections (Mirrors) • Transparency • Detail (Textures etc.) • Complex Illumination • Realistic Materials The light of Mies van der Rohe Modeling: Stephen Duck Rendering: Henrik Wann Jensen
Geometry 70s, 80s: Splines 90s: Range Data Rendering Algorithm 80s,90s: Physically-based Materials/Lighting (Texture, reflectance, Lighting) Realistic Input Models Required Arnold Renderer: Marcos Fajardo Photorealistic Rendering
Output Devices Processor Frame Buffer Memory Interactive CG Systems Input Devices Cathode Ray Tube (CRT) Liquid Crystal Display (LCD)
Cathode Ray Tube (CRT) Electron Gun Phosphor Field
Cathode Ray Tube (CRT) Electron Gun Phosphor Field Deflectors
Phosphors Decay • Light coming from a single phosphor does not last long. • Human eye can detect a difference within 20 milliseconds • To appear without flicker, the entire screen should be redrawn (Refreshed) at least 50 times per second (50 Hz)
The Frame Buffer • Phosphors are logically arranged into a 2D array of pixture elements (pixels) • The Frame Buffer stores the array of pixels that are to be activated when the display is refreshed • Resolution of Frame Buffer denotes the size of the array: e.g. 1280 x 1024
Frame Buffer Monochrome System Display 000000000000000000000000 000000000000000000000000 000000000000000000000000 000000000000000000000000 000011000011000000000000 000011000011000000000000 000000000000000000000000 000000000000000000000000 001000000000001000000000 000100000000010000000000 000010000000100000000000 000001111111000000000000 000000000000000000000000 000000000000000000000000 000000000000000000000000 000000000000000000000000 000000000000000000000000
Interlacing • Because phosphors are small, it is difficult for the eye to distinguish from one phosphor to the next. • Interlacing– To refresh every other row of the display within 50Hz.
Colors in the Frame Buffer • Depth: refers to how many bits represent each pixel. • Adding bits allows the frame buffer to store not only if a pixel is active, but also what color it should be • 8 bits = 256 colors
Triad Color CRT Deflectors Phosphor Field
Color Displays • Color code is stored in the frame buffer • Display translates color code into intensities for three electron guns. • Each gun fires into an appropriately colored phosphor in a group of three (known as a triad). • Triad = Pixel
Color Spectrum Our sense of color is derived from a physiological response to lightwaves in the visible electromagnetic spectrum
C(λ) 400 700 λ Color Blending • Light that we see is made up of photons moving at varying wavelengths • A Color is actually defined by continuous function C(λ) across all wavelengths of the visible spectrum
Human Visual System • Retina is comprised of Rod cells and 3 types of Cone cells Iris • Rods sense dark/light • Each type of the Cones responds best to a particular wavelength.
Tri-color Model • The eye breaks down incoming light into a triplet of values (RGB). • The brain converts that triplet back into a single (perceived) color • Instead of representing color as a continuous function, we can simplify our representation to a triplet of Red, Green & Blue intensities.
G (0,1,0) (1,1,0) (0,1,1) (1,1,1) (1,0,0) (0,0,0) R (0,0,1) (1,0,1) B RGB Color Cube
G (0,1,0) (1,1,0) (0,1,1) (1,1,1) (1,0,0) (0,0,0) R (0,0,1) (1,0,1) B RGB Color Cube What does this line represent?
Alternative Color Model: HSL • Hue: A specific color (usually selected on a continuum) • Saturation: How much is the dominant wavelength distinguished from the other colors (How much “white” has been added) • Lightness: How bright does the color appear.
Understanding HSL What is the darkest color possible? Black What is the lightest color possible? White What is the color if Saturation = 0? Gray What is the color if Saturation = 1? “Pure” Color
HSL Cones White Black
HSL Cones White Grayscale Black
HSL Cones Pure Color
Color Coding • Full spectrum can be specified using 3 numbers. (RGB or HSL) • These values can be coded into a single number and stored in the frame buffer
The Pinhole Camera and Synthetic Camera Models Image plane Pinhole • An ideal pinhole camera has an infinite depth of field (all points are in focus) • The angle of view : the angle made by the largest object that the camera can image on its film plane. Illustration courtesy Greg Humphries
Ray Tracing • Arbitrary paths: realism • Trace from light • Most light rays don’t hit eye • Eye Ray tracing • Primary Rays • Shadow Rays • Reflected/Transmitted Rays Appel 68
Pipeline Architecture for Graphics APIs (Application Programmer’s Interface) Frame Buffer Numeric Data Clipper Projector Rasterizer Transformer Graphics Renderer Numeric Data: Mathematical Representations of graphical shapes. Often in terms of vertices and lines.
Pipeline Architecture for Graphics APIs Frame Buffer NumericData Clipper Projector Rasterizer Transformer Transformer: Mathematical operations are performed on the data to handle movement and positioning of the graphical representation
Pipeline Architecture for Graphics APIs Frame Buffer Numeric Data Clipper Projector Rasterizer Transformer Clipper: Limits the size of the dataset to contain only information that should be displayed for a given point-of-view
Pipeline Architecture for Graphics APIs Frame Buffer Numeric Data Clipper Projector Rasterizer Transformer Projector: Until this stage, our numeric representation has been dealing with a 3D model. This stage reduces the dataset to 2D
Pipeline Architecture for Graphics APIs Frame Buffer Numeric Data Clipper Projector Rasterizer Transformer Rasterizer: The processed numeric information is finally converted into individual pixels
Pipeline Architecture for Graphics APIs Frame Buffer Numeric Data Clipper Projector Rasterizer Transformer Frame Buffer: Pixels are sent to the Frame Buffer to be displayed at the next refresh.
OpenGL • OpenGL is a graphics API • Software interface to graphics hardware • Hardware independent • No windowing or high-level tasks • Higher level API utilities available (GLU) • Application -> Higher level -> OpenGL -> Hardware • Window system separate (GLUT, Motif, etc.) • Benefits: • Fast, standard, portable, window-systemindependent • Other APIs GKS(Graphical Kernel System) PHIGS (Programmer’s Hierarchical Interactive Graphics System)
GL Related APIs GL: implements the Graphics Renderer using pipeline architecture GLU: (Utilities) provides some higher level interfaces for projections and viewing GLUT: (Utility toolkit) provides window management and event handling
Y Line Polygon Point x4,y4 x6,y6 x7,y7 x3,y3 x1,y1 x4,y4 x5,y5 x2,y2 x3,y3 x8,y8 x1,y1 x1,y1 x2,y2 X + Geographic Information System • A system for processing digital thematic maps • representing geographic features and their attributes.