Download
1 / 20
200 likes | 461 Vues
US EPA Region 1 Community Energy Challenge Supporting Local Energy Committees in their Efforts to Reduce Energy Use and GHG Emissions. Linda Darveau USEPA Region I (617) 918-1718 Darveau.Linda@EPA.GOv . Overview: C ommunity Energy Challenge. EPA is Challenging Every City and Town to:

E N D
US EPA Region 1 Community Energy ChallengeSupporting Local Energy Committees in their Efforts to Reduce Energy Use and GHG Emissions Linda Darveau USEPA Region I (617) 918-1718 Darveau.Linda@EPA.GOv
Overview: Community Energy Challenge • EPA is Challenging Every City and Town to: • Commit to energy efficiency by taking the Challenge • Benchmark buildings, schools, and/or wastewater treatment facilities • Set a target to reduce energy use by 10% or more • Promote energy efficiency and renewable energy in the community • High Profile Regional and National ENERGY STAR Recognition • EPA will provide free training and technical support
Energy and Climate Change in New England-Why Does EPA Care? • Energy production and use is the largest source of air pollution and greenhouse gas emissions in New England (and the nation) • Electricity rates – 40% higher • than national average • Demand for energy is • increasing • Strong need to slow increase in demand for energy and to provide cleaner sources of power • Energy Efficiency • Renewable Power
A warming climate (climate change) = climate impacts taking many forms
New England’s 1500 cities and towns spend nearly one billion dollars per year on energy in buildings
Energy Star • The Cheapest, Cleanest Energy is the Energy you Do Not Use • Municipalities can cut Energy Use by 30%
Develop a ROADMAP for Your Community • Inventory, Prioritization, Audits, Implementation & Outreach, Verification
Why Inventory and Benchmarking? Identify easiest opportunities to save money on energy budget Measure progress and quantify savings Communicate with public about successes in saving energy costs Attract state and federal monies for energy saving improvements to infrastructure (ex. EECBG) Establishes leadership role for residents to follow
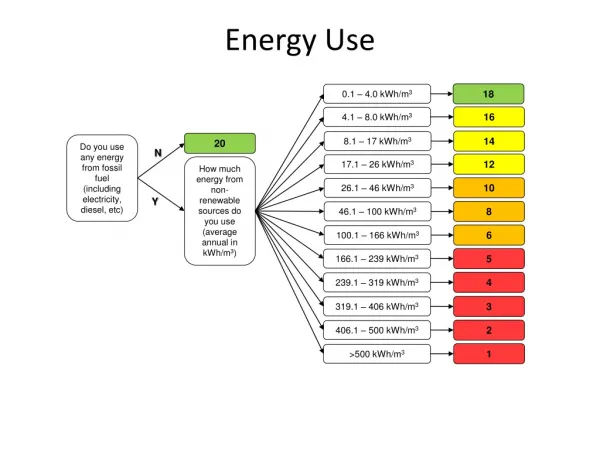
Performance Rating Systems Is 80 kBtu/sf/yr high or low for a building? Even many building experts don’t know. EPA Energy Performance Rating Fuel Efficiency Rating: MPG Is 10 MPG high or low for an automobile? Common knowledge.
Data Needed for InventorySTOCC and EPA PM • Electricity bills for buildings and streetlights • Access to online billing data • Kilowatt hours and total monthly costs • Heating fuel bills • Gallons and costs • Vehicle fuel bills for each vehicle • Gallons and costs • Support information • Building size and use data, heating fuel types, vehicle types
Tips for Conducting Inventory • Interns • Initial PowerPoint Presentation – begin timeline • Letter/Memo from City Manager/Mayor/BOS • Excel Sheet – central location • Public Presentation
TOWN Municipal Buildings Snapshot of Energy Use (mBTUs) by Municipal Building
TOWN Building Energy Intensity Site Energy Intensity and Average Site Energy Intensity for Type of Building (kBtu/sq.ft.)
Comparisons from STOCC City Community Transportation Buildings Vehicle Fleet Residential Streetlights Waste Commercial/Industrial Water/Sewer Percent of CO2 emissions
Communicating Results:What we spend as a town on our energy operating costs TOTAL: $48,003 • Buildings: $8,537 • Vehicle Fleet: $19,741 • Streetlights: $11,643 • Water & Sewage: $8,082
If we reduced what we spent on municipal energy by 30% we could afford to… • Provide Medicaid to 5 residents in our town • Hire a part time teacher for our school • Pay for ½ a new school • Feed 4 families for a year • Provide housing for one family for a year • Plant 144,000 trees • Brew 1,497 gallons of homemade beer
Questions? Contact: Linda Darveau U.S. EPA Region 1 617-918-1718 darveau.linda@epa.gov www.energystar.gov