Download
1 / 20
200 likes | 374 Vues
Water. Water in and on Proteins. Buried Water Molecules -Binding -Reactions Surface Water Molecules -Structure -Dynamics -Effect on Protein Motions. MD Simulation of Myoglobin. A-inside B-low density C-high density D-bulk. Svergun et al:

E N D
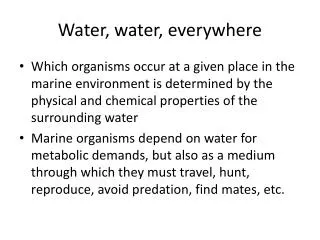
Water in and on Proteins Buried Water Molecules -Binding -Reactions Surface Water Molecules -Structure -Dynamics -Effect on Protein Motions
MD Simulation of Myoglobin A-inside B-low density C-high density D-bulk Svergun et al: First 3Å hydration layer around lysozyme ~10% denser than bulk water
Small Angle Neutron Scattering P(q) q(Å-1) Include Higher q : Chain Configurational Statistics Low q : Size Radius of Gyration (Rg)
Surface Water Molecules -Structure First 3Å hydration layer around lysozyme ~10% denser than bulk water Svergun et al PNAS 95 2667 (1998)
RADII OF GYRATION Geometric Rg from MD simulation = 14.10.1Å SMALL-ANGLE SCATTERING
Bulk Water (d) d Bulk Water Average Density Present Even if Water UNPERTURBED from Bulk o(d) Bulk Water (d) Water Protein o(d) 10% increase o(d)- (d) = Perturbation from Bulk 5% increase Radial Water Density Profiles
What determines variations in surface water density?
(1) Topography h=Surface Topographical Perturbation Protuberance L=3 surface Depression (2) Electric Field L=17 surface qi qj qk Simple View of Protein Surface
Surface Topography, Electric Field and Density Variations Low High O High H H High
Physical Picture: Water Dipoles Align with Protein E Field Water Density Variations Correlated with Surface Topography and Local E Field from Protein
Hydration of hydrophobic molecules Small molecules Bulk-like water “WET” • Large Exposed Surface Area • Fewer hydrogen bonds • “DEWETTING” Same effect in peptides?
ISABELLA DAIDONE Same effect in peptides? Prion Peptide - MKHMAGAAAAGAVV Lowest Free Energy density around hydrophilic groups “WET” Hydration Shell Density (nm-2) “DRY” density around hydrophobic groups hydrophobic analog Exposed Hydrophobic Surface Area (nm2)
Free Energy Profile Hydrophobic Hydration Shell Density (nm-2) Stable at High Hydration Density Met 109 (H) –Val 121 (O) (nm) 0 0.2 0.4 0.6 0.8 1.0 1.2 1.4 Stable at Low Hydration Density
KEI MORITSUGU Effect of Water on Protein Vibrations 1. MD Simulations and Normal Mode Analysis of Myoglobin 2. Langevin Analysis of each ´´MD normal mode´´ Velocity Correlation Function
Friction changes Frequency shifts solvation vacuum PES water PES Effect of Hydration on Protein Vibrational Motions Shift to high frequencies Increase of friction
Protein:Protein Interactions.Vibrations at 150K VANDANA KURKAL-SIEBERT
KEI MORITSUGU Diffusive and Vibrational Components 1. MD Simulation 2. Langevin Analysis of Principal Component Coordinate Autocorrelation Function.
KEI MORITSUGU Assume Height of Barrier given by Vibrational Amplitude. Find: V~ Diffusion-Vibration Langevin Description of Protein Dynamics Linear increase of vibrational fluctuations v.s. Dynamical transition of diffusive fluctuations