Download
1 / 20
200 likes | 333 Vues
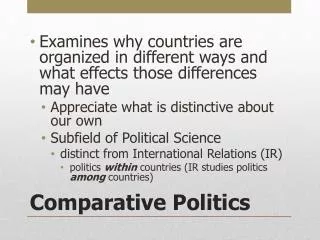
Analyzing Quantitative Data in Comparative Politics. Politics is a social science. Since politics is part science we can use statistics and data to measure levels of economic development , economic equality , quality of life , freedom , and government transparency. Empirical evidence.

E N D
Politics is a social science • Since politics is part science we can use statistics and data to measure levels of economic development, economic equality, quality of life, freedom, and government transparency
Empirical evidence • Empirical means that something is a fact, not disputed • For example: Japan consists of 4 main islands Japan’s population is 127.6 million (2012) China has the world’s second largest economy (GNP) Can you think of your own examples of empirical evidence?
Generally comparative politics data is considered to be empirical*** • Size of Economies (GDP/ GNP) • Purchasing Power of Consumers (PPP) • Economic equality (Gini Index) • United Nations Human Development Index (HDI) • Level of Freedoms (Freedom House Scores) • Government Transparency (Transparency International)
Size of Economies Gross Domestic Product (GDP) is the total market value of all goods and services produced in a country during a specific period For those of you taking economics GDP= (private consumption+ gross investment + government spending+ exports- imports) Gross National Product (GNP) is the total market value of all goods and services produced by residents of a country- this includes all wealth earned abroad (ex. American companies in Japan)
Total GNP Which country has the largest economy in the world? Any surprises on this list? China is ranked number 2. Does that mean that China is richer than Japan?
GDP/GNP per capita Often you will come across this measurement which is : GDP or GNP = GDP/GNP per capita Total Population Per capita means per person
Limitations of GDP per capita Does GDP per capita represent how much each citizen earns per year? What does it really measure?
Purchasing Power Parity (PPP) Purchasing Power Parity is the value in USD of what GDP can really buy in a given country It measures what 1USD buys in each country using a basket of goods Why might this be a better indicator than GDP per capita alone?
Economic equality (Gini Index) Gini index: a mathematical formula that measures the amount of economic equality in a society; its scale ranges from 0 to 100, where 0 corresponds to perfect equality and 100 to perfect inequality. Why would political scientists want to measure this?
Human Development Index (HDI) United Nations Index which measures a country’s socio-economic development GDP per capita, Life expectancy, and the Literacy rate are all factored in the calculation. The U.N. considers countries with a ranking closest to 1.0 as having the highest standard of living
Levels of Freedom • Freedom House (a non-governmental organization) measures the levels of freedoms in a country based on the following: political rights (right to vote etc.) civil liberties (freedom of the press etc.) It ranks countries on a scale of 1-10 and then places them in 3 categories: Free, Partly Free, and Not Free
Levels of Transparency • Transparency refers to the level of accountability a government has to its citizens • The less corruption= the more transparent • The more corruption= the less transparent • Like Freedom House, Transparency International is an NGO which ranks countries on a scale of 1-10 • The higher the number, the higher the transparency
Word of caution Do not confuse correlation with causation Correlation means two variables occur together but causation means one variable causes another High GDP per capita and democracy are correlated. But we can’t say high GDP per capita causes democracy