Download
1 / 1
10 likes | 88 Vues
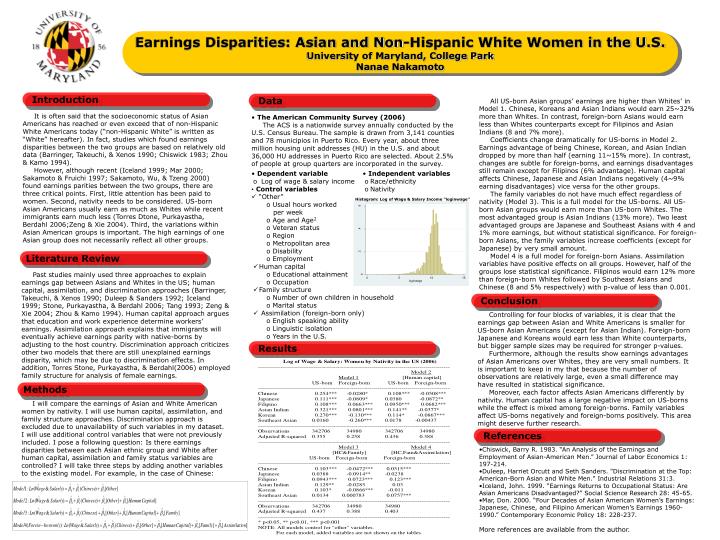
Dependent variable Log of wage & salary income Control variables “Other” Usual hours worked per week Age and Age 2 Veteran status Region Metropolitan area Disability Employment Human capital Educational attainment Occupation Family structure

E N D
Dependent variable • Log of wage & salary income • Control variables • “Other” • Usual hours worked • per week • Age and Age2 • Veteran status • Region • Metropolitan area • Disability • Employment • Human capital • Educational attainment • Occupation • Family structure • Number of own children in household • Marital status • Assimilation (foreign-born only) • English speaking ability • Linguistic isolation • Years in the U.S. • Independent variables • Race/ethnicity • Nativity Histogram: Log of Wage & Salary Income “loginwage” Earnings Disparities: Asian and Non-Hispanic White Women in the U.S.University of Maryland, College ParkNanae Nakamoto Insert Your Name Here Insert Name of Department Here Introduction Data All US-born Asian groups’ earnings are higher than Whites’ in Model 1. Chinese, Koreans and Asian Indians would earn 25~32% more than Whites. In contrast, foreign-born Asians would earn less than Whites counterparts except for Filipinos and Asian Indians (8 and 7% more). Coefficients change dramatically for US-borns in Model 2. Earnings advantage of being Chinese, Korean, and Asian Indian dropped by more than half (earning 11~15% more). In contrast, changes are subtle for foreign-borns, and earnings disadvantages still remain except for Filipinos (6% advantage). Human capital affects Chinese, Japanese and Asian Indians negatively (4~9% earning disadvantages) vice versa for the other groups. The family variables do not have much effect regardless of nativity (Model 3). This is a full model for the US-borns. All US-born Asian groups would earn more than US-born Whites. The most advantaged group is Asian Indians (13% more). Two least advantaged groups are Japanese and Southeast Asians with 4 and 1% more earnings, but without statistical significance. For foreign-born Asians, the family variables increase coefficients (except for Japanese) by very small amount. Model 4 is a full model for foreign-born Asians. Assimilation variables have positive effects on all groups. However, half of the groups lose statistical significance. Filipinos would earn 12% more than foreign-born Whites followed by Southeast Asians and Chinese (8 and 5% respectively) with p-value of less than 0.001. It is often said that the socioeconomic status of Asian Americans has reached or even exceed that of non-Hispanic White Americans today (“non-Hispanic White” is written as “White” hereafter). In fact, studies which found earnings disparities between the two groups are based on relatively old data (Barringer, Takeuchi, & Xenos 1990; Chiswick 1983; Zhou & Kamo 1994). However, although recent (Iceland 1999; Mar 2000; Sakamoto & Fruichi 1997; Sakamoto, Wu, & Tzeng 2000) found earnings parities between the two groups, there are three critical points. First, little attention has been paid to women. Second, nativity needs to be considered. US-born Asian Americans usually earn as much as Whites while recent immigrants earn much less (Torres Dtone, Purkayastha, Berdahl 2006;Zeng & Xie 2004). Third, the variations within Asian American groups is important. The high earnings of one Asian group does not necessarily reflect all other groups. • The American Community Survey (2006) • The ACS is a nationwide survey annually conducted by the U.S. Census Bureau.The sample is drawn from 3,141 counties and 78 municipios in Puerto Rico. Every year, about three million housing unit addresses (HU) in the U.S. and about 36,000 HU addresses in Puerto Rico are selected. About 2.5% of people at group quarters are incorporated in the survey. Literature Review Past studies mainly used three approaches to explain earnings gap between Asians and Whites in the US; human capital, assimilation, and discrimination approaches (Barringer, Takeuchi, & Xenos 1990; Duleep & Sanders 1992; Iceland 1999; Stone, Purkayastha, & Berdahl 2006; Tang 1993; Zeng & Xie 2004; Zhou & Kamo 1994). Human capital approach argues that education and work experience determine workers’ earnings. Assimilation approach explains that immigrants will eventually achieve earnings parity with native-borns by adjusting to the host country. Discrimination approach criticizes other two models that there are still unexplained earnings disparity, which may be due to discrimination effects. In addition, Torres Stone, Purkayastha, & Berdahl(2006) employed family structure for analysis of female earnings. Conclusion Controlling for four blocks of variables, it is clear that the earnings gap between Asian and White Americans is smaller for US-born Asian Americans (except for Asian Indian). Foreign-born Japanese and Koreans would earn less than White counterparts, but bigger sample sizes may be required for stronger p-values. Furthermore, although the results show earnings advantages of Asian Americans over Whites, they are very small numbers. It is important to keep in my that because the number of observations are relatively large, even a small difference may have resulted in statistical significance. Moreover, each factor affects Asian Americans differently by nativity. Human capital has a large negative impact on US-borns while the effect is mixed among foreign-borns. Family variables affect US-borns negatively and foreign-borns positively. This area might deserve further research. Results Methods I will compare the earnings of Asian and White American women by nativity. I will use human capital, assimilation, and family structure approaches. Discrimination approach is excluded due to unavailability of such variables in my dataset. I will use additional control variables that were not previously included.I pose a following question: Is there earnings disparities between each Asian ethnic group and White after human capital, assimilation and family status variables are controlled? I will take three steps by adding another variables to the existing model. For example, in the case of Chinese: References • Chiswick, Barry R. 1983. “An Analysis of the Earnings and Employment of Asian-American Men.” Journal of Labor Economics 1: 197-214. • Duleep, Harriet Orcutt and Seth Sanders. "Discrimination at the Top: American-Born Asian and White Men." Industrial Relations 31:3. • Iceland, John. 1999. “Earnings Returns to Occupational Status: Are Asian Americans Disadvantaged?” Social Science Research 28: 45-65. • Mar, Don. 2000. “Four Decades of Asian American Women’s Earnings: Japanese, Chinese, and Filipino American Women’s Earnings 1960-1990.” Contemporary Economic Policy 18: 228-237. • More references are available from the author.

![[Insert Advisor Name Here] [Insert Company Name Here]](https://cdn0.slideserve.com/147625/slide1-dt.jpg)


![[insert country name here]](https://cdn1.slideserve.com/1872534/slide1-dt.jpg)