Download
1 / 88
880 likes | 1.08k Vues
Foreword. SITUATIONAL ANALYSIS Atlas Van Lines conducts corporate relocation issues research on an annual basis. Traditionally, the research has been conducted as a mail survey – sent to companies throughout the United States. This year, Atlas Van Lines decided to

E N D
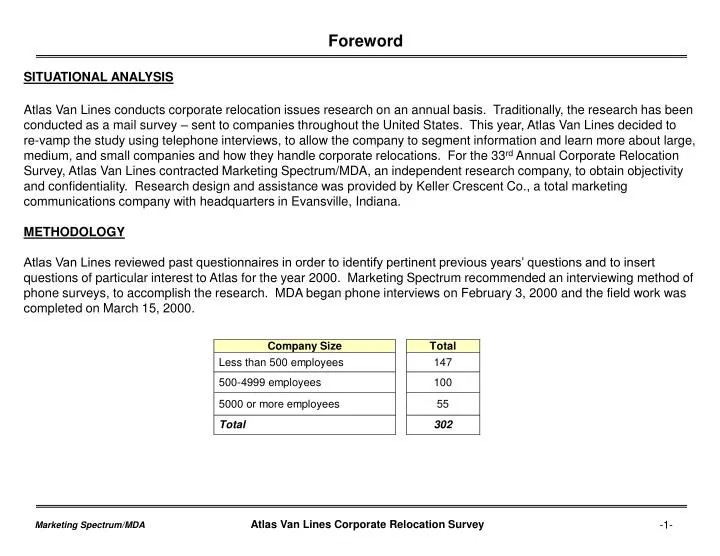
Foreword SITUATIONAL ANALYSIS Atlas Van Lines conducts corporate relocation issues research on an annual basis. Traditionally, the research has been conducted as a mail survey – sent to companies throughout the United States. This year, Atlas Van Lines decided to re-vamp the study using telephone interviews, to allow the company to segment information and learn more about large, medium, and small companies and how they handle corporate relocations. For the 33rd Annual Corporate Relocation Survey, Atlas Van Lines contracted Marketing Spectrum/MDA, an independent research company, to obtain objectivity and confidentiality. Research design and assistance was provided by Keller Crescent Co., a total marketing communications company with headquarters in Evansville, Indiana. METHODOLOGY Atlas Van Lines reviewed past questionnaires in order to identify pertinent previous years’ questions and to insert questions of particular interest to Atlas for the year 2000. Marketing Spectrum recommended an interviewing method of phone surveys, to accomplish the research. MDA began phone interviews on February 3, 2000 and the field work was completed on March 15, 2000. Marketing Spectrum/MDA Atlas Van Lines Corporate Relocation Survey
Management Summary Corporate Profile Manufacturing/Processing is the most highly represented business classification in this study. The following is a breakdown of respondents’ company business classifications: A little over half of these companies are international (54%); however, companies employing 5000 or more employees may drive this number. While only 39% of small companies are international, 76% of large companies are worldwide. The average annual sales for all companies involved in this study is $65.2 million. Almost half (49%) of the companies involved in this study employ less than 500 salaried workers, 33% employ 500-4999 employees; 18% have 5000 or more salaried employees. Marketing Spectrum/MDA Atlas Van Lines Corporate Relocation Survey
Management Summary Corporate Profile cont’d A little more than seven in ten (71%) companies have a formal relocation policy. Due to bigger budgets and more annual relocations, large companies (91%) are more likely to have a formal relocation policy than are small companies (54%). The same is true for centralized relocation departments. Around 80% of medium/large companies feel that a centralized relocation is a necessity while only 66% of small companies have a department entirely devoted to the administration of employee relocations. These centralized relocation departments are responsible for the following: - Controlling Household Goods Carrier Selection (77%) - Controlling Freight Carrier Selection (74%) Carrier selection is mainly the responsibility of the company (40%). The other 60% of companies decide on a carrier via the following methods: The average number of employees relocated in 1999 moved: Relocations between foreign countries and those from the U.S. to foreign countries are not included. As expected, large companies account for more relocations. Marketing Spectrum/MDA Atlas Van Lines Corporate Relocation Survey
Management Summary Decision Maker (Respondent) Profile The majority of respondents (78%) work in Human Resources/Personnel. A variety of respondents completed this survey – from managers (26%) to relocation administrators (27%) to other unspecified positions (24%). A little over half (57%) of decision makers read trade publications: - HR Magazine (37%) - Mobility (28%) Almost eight in ten (79%) employees do not belong to any relocation-related associations. As with many other measures in this study, employees in larger companies are more likely to belong to a relocation-related association. In comparison to 1998, companies allocated more money for relocations in 1999. A little more than eight in ten (83%) relocation decision makers say that their 1999 relocation budget either increased or stayed the same: - 44% increased from 1998 budget - 39% stayed the same as 1998 budget - 17% decreased from 1998 relocation budget Marketing Spectrum/MDA Atlas Van Lines Corporate Relocation Survey
Management Summary Transferee Profile The most frequently transferred employee is in his thirties with the average age being 36 years. An average of 101 employees were transferred in 1999. Larger companies drive this number with an average of 306 employees being transferred in 1999. The following is the makeup of those employees transferred in 1999: - 20% women (Despite societal advances, husbands are less likely to follow wives, hence fewer relocations among women) - 60% had trailing spouses While a little more than half of respondents (52%) feel that relocation will stay the same in 2000, 29% anticipate an increase and 19% feel that there will be a decrease in the number of relocations in 2000. Only 29% of respondents feel that external factors had a significant impact on the number of employee transfers in 1999. These people feel that the following external factors had an impact: - Economic Conditions (59%) - Lack of Qualified People (52%) Marketing Spectrum/MDA Atlas Van Lines Corporate Relocation Survey
Management Summary Transferee Profile cont’d In contrast to external factors, more than half (54%) of respondents feel that internal factors had a significant impact on the number of employee transfers in 1999. Internal factors were especially likely to impact larger companies. The following internal conditions are significant: - Growth of Company (76%) - Promotions/Resignations (74%) - Expansion into New Territories (64%) Companies vary on the amount of time they allow employees to decide on whether to accept a relocation offer. Some employees (39%) have up to two weeks to accept an offer, others (27%) have up to one month to decide, while some have only one week or less to accept (14%). Larger companies usually allow the employee more time to accept a relocation offer. The majority of companies allow the hiring of spouses of employees (79%). The smaller the company the less likely it is to allow spouses to join the workforce. Marketing Spectrum/MDA Atlas Van Lines Corporate Relocation Survey
Management Summary Policy Administration In total, only 40% of companies outsource relocation services. However, this low number appears to be driven by companies of less than 500 employees. Almost two-thirds (65%) of large companies outsource some or all relocation services. Of those companies who do outsource, the services that are most likely to be outsourced are: - Household goods transportation (80%) - Real estate (79%) Only 36% of decision makers say that the internet is used for relocation-related matters. Those who do use the internet use it for a variety of purposes: - To communicate via e-mail with relocating employees (86%) - To research relocation-related matters (77%) - For matters unrelated to relocation (70%) On average, employees are allowed 4.6 expense-paid house-hunting days; spouses are allowed to accompany the employee on 1.7 expense-paid house-hunting trips. Marketing Spectrum/MDA Atlas Van Lines Corporate Relocation Survey
Management Summary Relocation Costs The following are companies’ methods of reimbursement of moving expenses: If an employee decides to buy a home in the new location, companies will cover a variety of moving expenses. - 78% pay to pack all items - 74% pay to move exercise equipment - 73% pay to move an automobile - 63% pay to move recreation and lawn equipment - 62% pay to carry items down from the attic If an employee decides to rent, companies cover the following: - 71% offer home finding trips - 65% reimburse for lease cancellation - 65% offer to move one or more automobiles - 61% offer storage Marketing Spectrum/MDA Atlas Van Lines Corporate Relocation Survey
Management Summary Relocation Services Only 38% of companies assist an employee’s spouse/partner in finding employment in the new location. These companies help in the following ways: - 43% assist the spouse/partner in finding a job outside of the company - 30% pay job finder’s fees - 23% assist the spouse/partner in finding a job within the company - 4% pay the spouse/partner's salary until hired On average, only 13% of employees employed by companies who offer spouse/parner employment assistance, took advantage of it in 1999. Only 8% of companies provide elder care assistance to the transferee. Assistance provided by these companies includes: - Provides a list of nursing homes (68%) - Moves the elderly relative (26%) - Reimburses for outside care (10%) - Allows the transferee to use pre-tax dollars for outside care (10%) - Moves the elderly relative that does not live with the transferee (5%) Approximately one in five (22%) respondents believe that an employee’s willingness to relocate is never affected by his/her spouse’s employment status. Half (50%) believe that employees’ willingness to relocate is seldom affected. 18% say an employee’s spouse’s employment status frequently affects his/her relocation decision, 10% say it almost always does. Marketing Spectrum/MDA Atlas Van Lines Corporate Relocation Survey
Management Summary Relocation Services cont’d The majority of (79%) respondents say that declining the opportunity to relocate does not hinder an employee’s career. A little over seven in ten (72%) respondents feel that the number of employees who declined relocation offers did not change between 1998 and 1999. Two in ten (20%) say that the number of employees declining relocation offers in 1999 decreased. Only 39% of employees who were asked to relocate in 1999, declined the opportunity. Reasons given were: - Family ties (87%) - Personal reasons (77%) - No desire to move (77%) - Spouse’s employment (65%) The average number of relocation carriers companies have contractual agreements with is 2.4. Marketing Spectrum/MDA Atlas Van Lines Corporate Relocation Survey
Management Summary Transportation A little more than six in ten (63%) of respondents say that their company does have preferred contract carriers. Only 30% of companies included in the survey outsourced services to a relocation service or brokerage firm in 1999. The services provided to these firms are: - Real estate sale/purchase (89%) - Contract of household goods moving company (74%) - Orientation tours in the new location (72%). The most important attributes when selecting a contract carrier are: - Service (94%) - Price (76%) - Reputation (72%) - Claims processing (70%) When evaluating a carrier, 95% say that the most important attribute is service, 89% say on-time delivery, 80% say price, 79% say employee feedback, and 70% say claims processing. From the employee’s perspective, the most important aspects of a move are: - Claims processing (81%) - Packer (77%) - Driver (70%) A little more than two in ten (22%) companies use electronic transfer of funds to their contract carrier; 15% use on-line access with their carrier for shipment records/history, and 14% use on-line registration access with their carrier. Marketing Spectrum/MDA Atlas Van Lines Corporate Relocation Survey
Management Summary Geography A little more than eight in ten (83%) companies relocated employees to the United States in 1999, while only 15% of employees were relocated to Canada, and 8% to Mexico. When choosing a cross-border carrier, a majority of respondents (98%) say that service is most important, followed by price (84%), scheduling (82%), and reputation (77%). International Among companies that did relocate employees internationally, relocations to and from the United States dominated international relocations, with foreign relocations from the U.S. being slightly more common than U.S. relocations from abroad. Relocations between two foreign countries were the least common and represented less than half of those either to or from the U.S. to a foreign country. Almost nine in ten (88%) companies offer additional leave time to internationally relocated employees, 80% offer additional leave time that includes travel and at least one visit to the United States or Canada, 69% offer additional tax considerations, 67% offer extended per diem charges for a hotel, and 67% offer increased allowances for permanent storage. More than half (53%) of companies have never used the electronic data interchange (EDI) interface capabilities on international shipments. A little over two in ten (23%) seldom use EDI. A little over three-fourths of companies (77%) offer no assistance to internationally transferred employees’ spouses/partners in finding employment in the new location. Of those companies who do offer this assistance, an average of 35% of internationally relocated employees in 1999 took advantage of this. Marketing Spectrum/MDA Atlas Van Lines Corporate Relocation Survey
Management Summary International cont’d Only 24% of international relocations were declined or failures for lack of adaptability by the spouse/partner (36%), other reason unspecified (36%), lack of adaptability by the employee (29%), or lack of spouse/partner assistance (21%). Marketing Spectrum/MDA Atlas Van Lines Corporate Relocation Survey
Corporate Profile Business Classification Q.1 Less than 500 Salaried Employees Total 500 – 4999 Salaried Employees 5000+ Salaried Employees Marketing Spectrum/MDA Atlas Van Lines Corporate Relocation Survey
Corporate Profile Company Type Q.2 Less than 500 Salaried Employees Total 500 – 4999 Salaried Employees 5000+ Salaried Employees Marketing Spectrum/MDA Atlas Van Lines Corporate Relocation Survey
Corporate Profile Company’s Average 1999 Annual Sales Q.3 In Millions Marketing Spectrum/MDA Atlas Van Lines Corporate Relocation Survey
Corporate Profile Salaried Employees Q.4 MEAN: 2064 Salaried Employees Marketing Spectrum/MDA Atlas Van Lines Corporate Relocation Survey
Corporate Profile Formal Relocation Policy Q.5 Marketing Spectrum/MDA Atlas Van Lines Corporate Relocation Survey
Corporate Profile Administration of Employee Relocations from Centralized Department Q.6 Less than 500 Salaried Employees Total 500 – 4999 Salaried Employees 5000+ Salaried Employees Marketing Spectrum/MDA Atlas Van Lines Corporate Relocation Survey
Corporate Profile Centralized Relocation Department Duties Q.7 Total Marketing Spectrum/MDA Atlas Van Lines Corporate Relocation Survey
Corporate Profile Centralized Relocation Department Duties Q.7 *indicates small sample size ~indicates approximation Marketing Spectrum/MDA Atlas Van Lines Corporate Relocation Survey
Corporate Profile Carrier Selection Q.8 Total Marketing Spectrum/MDA Atlas Van Lines Corporate Relocation Survey
Corporate Profile Carrier Selection Q.8 Marketing Spectrum/MDA Atlas Van Lines Corporate Relocation Survey
Corporate Profile Relocation Destination Q.9 Average # of Employees Relocated to Each Location in Total Marketing Spectrum/MDA Atlas Van Lines Corporate Relocation Survey
Corporate Profile Relocation Destination Q.9 By Company Size *indicates less than 0.5 Marketing Spectrum/MDA Atlas Van Lines Corporate Relocation Survey
Decision Maker Profile Department Function Q.10 Total Marketing Spectrum/MDA Atlas Van Lines Corporate Relocation Survey
Decision Maker Profile Department Function Q.10 By Company Size (Salaried Employees) Traffic/Transportation Compensation/Benefits Relocation Services Administration Other Human Resources Marketing Spectrum/MDA Atlas Van Lines Corporate Relocation Survey
Decision Maker Profile Position with the Company Q.11 Marketing Spectrum/MDA Atlas Van Lines Corporate Relocation Survey
Decision Maker Profile Position with the Company Q.11 Less than 500 Salaried Employees 500 – 4999 Salaried Employees 5000+ Salaried Employees Marketing Spectrum/MDA Atlas Van Lines Corporate Relocation Survey
Decision Maker Profile 1999 Relocation Budget in Comparison to 1998 Q.12 Less than 500 Salaried Employees Total 500 – 4999 Salaried Employees 5000+ Salaried Employees Marketing Spectrum/MDA Atlas Van Lines Corporate Relocation Survey
Decision Maker Profile Trade Publications Q.13a & Q.13b Do you read trade publications? Trade Publications Respondents Read Trade Publications with less than 2% Readership are not shown Marketing Spectrum/MDA Atlas Van Lines Corporate Relocation Survey
Decision Maker Profile Trade Publications Q.13a & Q.13b *indicates small sample size Trade Publications in Total with less than 2% Readership are not shown Marketing Spectrum/MDA Atlas Van Lines Corporate Relocation Survey
Decision Maker Profile Relocation-Related Association Membership Q.14 Less than 500 Salaried Employees Total 500 – 4999 Salaried Employees 5000+ Salaried Employees Marketing Spectrum/MDA Atlas Van Lines Corporate Relocation Survey
Transferee Profile Age Range of Frequently Transferred Employees Q.15 Total Average Age = 36 years Marketing Spectrum/MDA Atlas Van Lines Corporate Relocation Survey
Transferee Profile Age Range of Frequently Transferred Employees Q.15 By Company Size (Salaried Employees) Marketing Spectrum/MDA Atlas Van Lines Corporate Relocation Survey
Transferee Profile Number of Employee Transfers in 1999 Q.16 Average Marketing Spectrum/MDA Atlas Van Lines Corporate Relocation Survey
Transferee Profile Percentage of Employees Transferred in 1999 who are Women Q.17 Average Marketing Spectrum/MDA Atlas Van Lines Corporate Relocation Survey
Transferee Profile Percentage of Transfers Involving a Trailing Spouse in 1999 Q.18/Q.19 Average Marketing Spectrum/MDA Atlas Van Lines Corporate Relocation Survey
Transferee Profile 2000 Relocation Anticipation Q.20 Less than 500 Salaried Employees Total 500 – 4999 Salaried Employees 5000+ Salaried Employees Marketing Spectrum/MDA Atlas Van Lines Corporate Relocation Survey
Transferee Profile External Factors Q.21 Total 29% of Respondents (Base = 66) felt that external factors had an impact on the number of employee transfers in 1999 Marketing Spectrum/MDA Atlas Van Lines Corporate Relocation Survey
Transferee Profile External Factors Q.21 By Company Size (Salaried Employees) *indicates small sample size ~indicates approximation Marketing Spectrum/MDA Atlas Van Lines Corporate Relocation Survey
Transferee Profile Internal Factors Q.22 Total 54% of Respondents (Base = 129) felt that internal factors had an impact on the number of employee transfers in 1999 Marketing Spectrum/MDA Atlas Van Lines Corporate Relocation Survey
Transferee Profile Internal Factors Q.22 By Company Size (Salaried Employees) ~indicates approximation *indicates small sample size Marketing Spectrum/MDA Atlas Van Lines Corporate Relocation Survey
Transferee Profile Length of Transfer Offer Q.22b Total Marketing Spectrum/MDA Atlas Van Lines Corporate Relocation Survey
Transferee Profile Length of Transfer Offer Q.22b By Company Size (Salaried Employees) *indicates small sample size Marketing Spectrum/MDA Atlas Van Lines Corporate Relocation Survey
Transferee Profile Allowance of Hiring of Spouses of Employees Q.23 Less than 500 Salaried Employees 500-4999 Salaried Employees 5000+ Salaried Employees Marketing Spectrum/MDA Atlas Van Lines Corporate Relocation Survey
Policy Administration Outsourcing of Services Q.24, Q.25 Marketing Spectrum/MDA Atlas Van Lines Corporate Relocation Survey
Policy Administration Outsourcing of Services Q.24 Large companies are more likely to outsource some or all relocation services. Almost two-thirds (65%) of large companies outsource while only 19% of small companies outsource relocation services. By Company Size (Salaried Employees) Marketing Spectrum/MDA Atlas Van Lines Corporate Relocation Survey
Policy Administration Outsourcing of Services Q.25 By Company Size (Salaried Employees) *indicates small sample size Marketing Spectrum/MDA Atlas Van Lines Corporate Relocation Survey
Policy Administration Internet Usage Q.26a, Q.26b Is the Internet Used for Relocation-Related Matters? How is the Internet Used for Relocation-Related Matters? Marketing Spectrum/MDA Atlas Van Lines Corporate Relocation Survey