Download
1 / 22
220 likes | 301 Vues
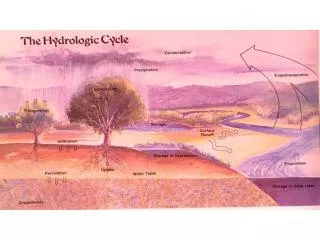
From real to virtual observatories: sustaining and improving water and soil science. Doerthe Tetzlaff. Northern Rivers Institute, Aberdeen www.abdn.ac.uk/nri. Real observatories at different scales. Catchment scale. Hillslope scale. Reach scale.

E N D
From real to virtual observatories: sustaining and improving water and soil science Doerthe Tetzlaff Northern Rivers Institute, Aberdeen www.abdn.ac.uk/nri
Real observatories at different scales Catchment scale Hillslope scale Reach scale
Conceptualization – capturing connections at different scales • How can we capture environmental variability (water flow paths, storage, transit times…) in the landscape? 1st order streams 3rd order streams 2nd order streams zero order streams • Different scales, geographical environments… • Different approaches: mapping tool, qualitative conceptual model, physical model…
Cross-regional observatories – Contextualisation of insights Allt a’ Mharcaidh Dee (2000 km2) Feshie Aberdeen North Esk (800 km2) Girnock (30 km2)
Towards an integrated process understanding 3. Towards prediction / Upscaling / Connection 1. Landscape composition / configuration 2. Runoff sources / Mean transit times
“Freely draining” Humus Iron Podzol “Responsive” Peat / Peaty Gley Saturation overland flow Shallow sub-surface storm flow Deep sub-surface storm flow Groundwater recharge Soils and hydrological response in a typical upland catchments 30 km2 Girnock Burn catchment Soulsby et al. (2006a). J. of Hydrol. 325, 197-221. Soulsby et al. (2006b). Hydrol. Proc. 20, 2461-2465. Tetzlaff et al. (2007a). Hydrol. Proc. 21, 1289-1307.
The Girnock catchment (30 km2) Saturation area: Importance for non-linear hydrological response
Hydrology Of Soil Types (HOST) - digital data base http://www.macaulay.ac.uk/host/hostdist.htm • - 29 classes which integrate: • Geology • Topography • Climate • Vegetation • Infer hydrological pathways from soil properties Tetzlaff et al. (2007a) Hydrol. Proc. 21, 1289-1307: Conceptualisation of runoff processes using GIS and tracers in a nested mesoscale catchment.
Conservative tracers for rainfall-runoff dynamics Streamwater McGuire and McDonnell, 2006 JoH
Conservative tracers 50% 50% Cum. densities function Deep-subsurface flow dominated catchment Fast responding catchment Response of catchments: Short TT (rapid connection) / Longer TT (slower connections) Tetzlaff et al (2007b) J. of Hydrol. 346, 93-111. Hrachowitz et al (2009) J. of Hydrol. 367, 237-248.
Incorporation of non-linearity in catchment response 5-30% of catchment area Dry Saturation area extent = f (API, ET, Soils) Wet Birkel et al., 2010, Towards simple dynamic process conceptualization in rainfall runoff models using multi-criteria calibration and tracers in temperate, upland catchments.Hydrological Processes.
Non-linearity + high resolution tracers as objective measures Improved representation of system behaviour Means of constraining models C. Birkel et al., Water Resources Research, in press: Using time domain and geographic source areas tracers to conceptualize streamflow generation processes in rainfall-runoff models.
Some problems with real observatories Fragmentation at all levels: Spatial, temporal gaps in data Individual and unlinked models Limited linkages between disciplines, institutes, agencies, countries (within and outwith UK) Environmental community does not embrace new information technologies / is poorly equipped to exploit those Need for consistency in approaches
EVOp Vision Pilot: proof of concept project to demonstrate that linking data, models and expert knowledge will provide cost effective answers to wide-ranging environmental issues (initially soil - water system)
The team • Leadership and Management team • Adrian McDonald (Leeds) • Robert Gurney (Reading) • Bridget Emmett (CEH) • WP leaders • Phil Haygarth (Lancaster) • Jim Freer (Bristol) • Wouter Buytaert (Imperial) • Gordon Blair (Lancaster) & Gwyn Rees (CEH) • Doerthe Tetzlaff (Aberdeen) Full team • Keith Beven (Lancaster) • Gordon Blair (Lancaster) • John Bloomfield (BGS) • Roland Bol (Rothamsted) • Wouter Buytaert (Imperial) • Bridget Emmett (CEH) • Jim Freer (Bristol) • Robert Gurney (Reading) • Phil Haygarth (Lancaster) • Penny Johnes (Reading) • Paul Quinn (Newcastle) • Mark Macklin (Abserystwyth) • Christopher Macleod (Macaulay) • Adrian McDonald (Leeds) • Sim Reaney (Durham) • Gwyn Rees (CEH) • Marc Stutter (Macaulay) • Doerthe Tetzlaff (Aberdeen)
Objectives (i) To make environmental data more visible / accessible to wide range of potential users and free to use for public; (ii) To provide tools to facilitate integrated analysis of data, greater access to added knowledge and expert analysis, and visualisation of results; (iii) To develop new, added-value knowledge from public and private sector data to help tackle environmental challenges.
Strategy for the Pilot (£2M) Start with mature community which has good stakeholder engagement (i.e. soils and water) and build on various ongoing initiatives: Data/portals EU /Global observatories Environmental issue EXEMPLARS Environmental issue Soiltrec Dedicated data centres Alternet Environmental issue Expeer GMES Hydronet Flooding Diffuse pollution Water resources Inspire Sensors Models National Capability Transparency Demonstration test Catchments Decision support tools Earth Observation Framework UK observatories
Project structure 2 WPs to develop cyber infrastructure: data and modelling tools. These will underpin development of 2 exemplars based on soil and water questions framed in local and national context Internationalisation
An environmental cloud A space for: • Exploring data • Linking models • Accessing added knowledge • Visualisation tools To deliver more: • Efficient, effective and transparent use of environmental data, models and knowledge
Questions the EVO could help answer Scientists How do we define which model is better to select from our model ensemble? What kind of language/tools to use to make models “talk” to each other. Government Agencies What models work? What policy works? How do I do it for less money? EVO cloud • Regulators • How can we reduce monitoring for same information? • Credible apportioning of pollutant load between industry, water, agriculture, other. • Water Industry • What is the whole impact of future flooding? • How can water security be assured? • How can the industry carbon impact be reduced? Public Will my town run out of water? What is the state of the local river? What are the options to protect us from future flooding?
What is benefit for scientists? • Currently: many wheels constantly re-invented • Re-implementing models, file import and export routines etc. • Tools and models library will stop this re-invention • Fewer wheels, more environmental science. • Models to be tested as hypotheses about system functioning • Longer term: understanding gained will be used in extending the VO within and outside UK.
”The more closely we search, the more elusive the edge becomes”(K. Dean Moore) Many thanks for your attention!!! Check out for papers and posters: www.abdn.ac.uk/nri