1 / 10
100 likes | 111 Vues
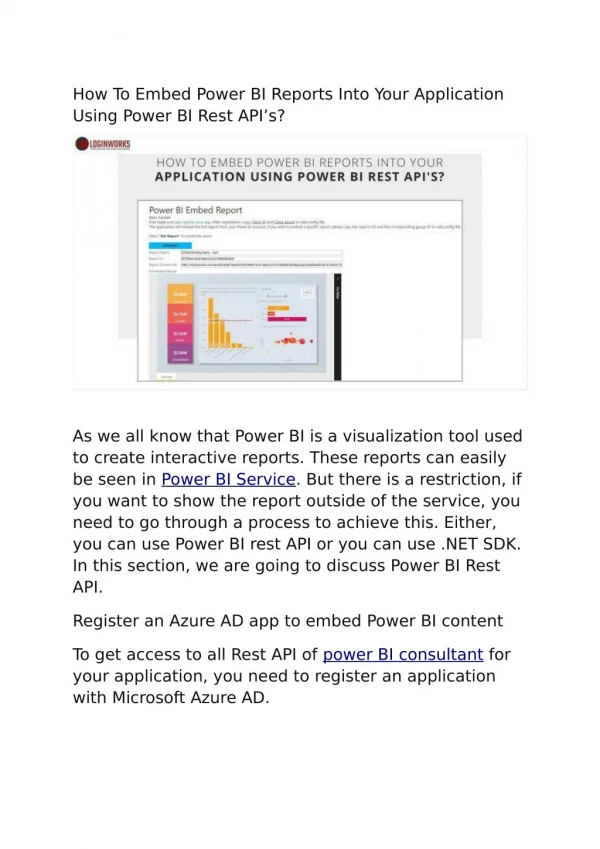
Several firms opt for creating modern intranet in SharePoint within the Office 365 circle which is why it is so useful to create reports with the help of it. It is also a safe space for storing all of your Microsoft Power BI reports. Read more: https://www.codecreators.ca/power-bi-consulting/

E N D
How to Create a Power BI Dashboard Download Power BI’s Desktop Version Power BI has two versions, desktop version and online version. However, we recommend that you begin by downloading the desktop version of Power BI to create your frst dashboard. Once you are done, you can proceed to publish your dashboard on the online version of Power BI where it can be shared easily with the rest of your colleagues.
Getting Data From SharePoint After opening Power BI, click on Get Data button which can be found on the Home tab along the ribbon. This is where you can gain access to all the data sources at your disposal.
Selecting the Right Data Type Here, you will fnd three kinds of SharePoint Data Connectors listed as follows, 1. Folders 2. Online Lists 3. Regular Lists You can choose which object type suits you best and then add your SharePoint URL.
Loading Your Data On your left side, you will be able to choose the relevant list or folder. You will see a preview of all the data that can be loaded in the Navigator window.
Editing Query and Making Good Visuals Before you load the data into your Power BI, we recommend you adjust, shape, or modify your data any way you need to. If it is the matter of a query, this will be a good time to edit it before you begin working on a larger data set. How to edit the query, you ask? The process is simple. Click on Edit, and then continue to make any adjustments you need to in the Query Editor.
Publishing Your Report on Power BI Online Proceed to the Power BI home screen and login where you will see your report in gray in the middle of the very left column, here you will see a few elements such as Workspace, Dashboard, Reports and Data Sets.
Transforming Your Report into a Dashboard This is the easiest part. In order to turn your report into a dashboard, all you need to do is access your report and click on the pin icon. From here, you can either select or create the dashboard you would like to have your visuals displayed on.
THANKS FOR WATCHING DO YOU REQUIRE POWER BI AND SHAREPOINT ONLINE DO YOU REQUIRE POWER BI AND SHAREPOINT ONLINE FOR YOUR BUSINESS? FOR YOUR BUSINESS? TALK TO US +1 647 521 - 7558 help@codecreators.ca www.codecreators.ca