Download
1 / 36
360 likes | 484 Vues
THAMES HUB AIRPORT. Global Context – City population 2012. Latitude. London. Istanbul. Beijing. New York. Tokyo. Dubai. Graph showing geographical distribution of population for the largest 2000 metro areas on the left, and summated by latitude on the right.

E N D
Global Context – City population 2012 Latitude London Istanbul Beijing New York Tokyo Dubai Graph showing geographical distribution of population for the largest 2000 metro areas on the left, and summated by latitude on the right. (Data from the Hambalt 6000 model). Sao Paulo Sydney Metro Popn 2012 0 36,500,000 Global Population % Longitute
Global Context – London’s access to global GDP GDP% within 13 hours London Istanbul Beijing Tokyo Dubai New York Sao Paulo Seats 2012 0 85,677,685 Sydney GDP% within 3 hours Graph showing for each of the top metro areas the percentage of GDP accessible by short-haul and long-haul flight distances. City circle size proportional to current available flight capacity (measured in seats). Map centred on London showing metro areas sized by GDP, rings showing locations accessible within the time frame of a short-haul (3hrs) and a long-haul (13hrs) flight.
Regional Context Graph on population growth Stansted London’s growth is to the east, this is where new infrastructure will have to be built and to accommodate 2m more people. It is least populated area now and is where we need to do strategic development. Thames Hub Heathrow London City Gatwick
Regional Context Graph on population growth Stansted London’s growth is to the east, this is where new infrastructure will have to be built and to accommodate 2m more people. It is least populated area now and is where we need to do strategic development. Thames Hub Heathrow London City Gatwick
Euro control, quote by 2030 27 European airports will be full This is perceived as a UK problem but it is Europe wide. Headlines on capacity constraint Leapfrog Air Traffic Movements – Capacity 2014 800,000 600,000 400,000 Annual Movements (flights) 200,000 0 Amsterdam Frankfurt Paris Heathrow Sources: BAA, Fraport, Schiphol Group, ADP, ACI
Euro control, quote by 2030 27 European airports will be full This is perceived as a UK problem but it is Europe wide. Headlines on capacity constraint Leapfrog Air Traffic Movements – Unused Capacity 2014 800,000 26.5% 25.5% 30% 600,000 1.5% 400,000 Annual Movements (flights) 200,000 0 Amsterdam Frankfurt Paris Heathrow Sources: BAA, Fraport, Schiphol Group, ADP, ACI
Euro control, quote by 2030 27 European airports will be full This is perceived as a UK problem but it is Europe wide. Headlines on capacity constraint Leapfrog Air Traffic Movements – Capacity 2030 800,000 600,000 400,000 Annual Movements (flights) 200,000 0 Amsterdam Frankfurt Paris Heathrow With 3rd runway Sources: BAA, Fraport, Schiphol Group, ADP, ACI
Euro control, quote by 2030 27 European airports will be full This is perceived as a UK problem but it is Europe wide. Headlines on capacity constraint Leapfrog Air Traffic Movements – Capacity 2030 800,000 600,000 400,000 Annual Movements (flights) 200,000 0 Amsterdam Frankfurt Paris Heathrow With 3rd runway Maintaining the UK’s hub status Sources: BAA, Fraport, Schiphol Group, ADP, ACI
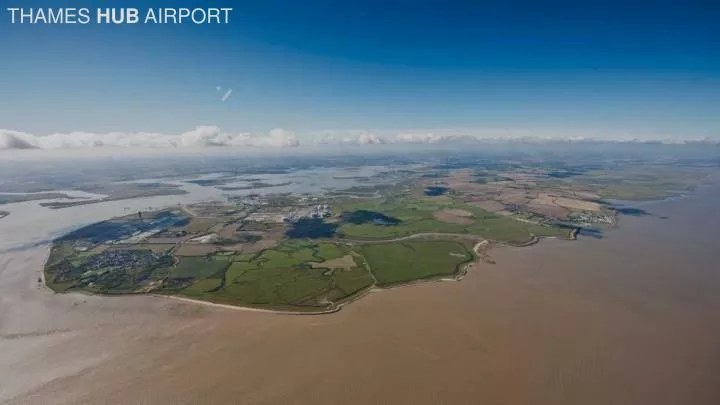
Proposed Airport : Isle of Grain 24 Hour 110 million passengers Expand to150 million + 4 runways Resilient Adjacent to HS1 Accessible from Europe, UK, and London Deliverable by the private sector
Carbon and Estuary • Commission information on emissions and how we fit • All solutions face same carbon emission limits. We can design something with lowest carbon access, most efficient ground movement and efficient runway access
Surface Access HS2 High speed in Europe with airports shown Crossrail The infrastructure already exists. Javelin capacity figure. Design for 110mppa with existing to get to 2040 and work in conjunction with other investments for London’s expansion. HS1
Surface Access Parkway/ Journey Time catchment and surface connectivity London Quadrant diagram with Park and Ride
Value to economy of belly freight 90% of airfreight by value is belly freight from Heathrow
Flight paths over areas of low population NoisePopulation 54 dB 152,018 57 dB 21,812 60 dB 2,695 63 dB 926 66 dB 453 66 dB 0 66 dB 18 69 dB 985 72 dB 22 72 dB 1,034
Noise • Ears don’t • read numbers The number of people living within Heathrow’s 57L Aeq Contour has fallen significantly despite higher numbers of air traffic movements. (Source:CAA, courtesy of Airports Commissions) Its nosier, stats on complaints
Airspace • Quote from NATS in TFL report SESAR Statements and need to replan. • Question City impact. Means you close Heathrow, Planefinder.net
Coastal Airports Tokyo International Airport Hong Kong International Airport Singapore Changi Airport Ataturk International Airport John F. Kennedy International Airport San Francisco International Airport
Natural Environment Impact • Our or others map of designated sites. • Any information from current flooding or storm surge. EATE 2100 Report
Natural Environment Impact Intertidal habitat replacement area in TE2100 report • Our or others map of designated sites. • Any information from current flooding or storm surge. EATE 2100 Report • Info on Wallasea Island and South East Flooded Land
Natural Environment Impact Wallasea Island created by Crossrail spoil
1,266 live within the airport footprint 311 348 230 374 413 295 328 355 353 294 317 • Usual Resident Population, 2011 Usual Resident Population, 2011
Cost – £20 billion • Item £billion • Land Purchase / Legal Fees 3.44 • Land reclamation 1.77 • Site preparation 0.07 • Formation of compensatory habitats for birds 1.21 • Runways, taxiways and aircraft aprons 1.93 • Terminal and satellite buildings and airport roads 7.71 • Air traffic control equipment and navigational aids 0.06 • Consolidation centres 0.02 • Maintenance facilities 0.09 • Ground support equipment facilities 0.05 • Central plant to serve the campus 0.14 • Fire stations and other rescue services 0.10 • On-site access roads and landscaping 0.25 • Long and short stay car parking 0.42 • Airport offices 1.24 • Compensation / Transition Costs 1.50 • Total 20.00 • DL figures two stage. Global benchmark local measure. Cross checked by a leading airport operator and contractor Image of a crane with an aircraft at heathrow Heathrow third runway £18 billion Thames Hub 4 runways £20 billion
The Business Model - Assumptions RAB based, only passenger can pay Promotion group, delivery sale to operator Allocation of risk
Redevelopment at Heathrow University Commerical Residential Entertainment Technology