Download

1 / 25
250 likes | 350 Vues
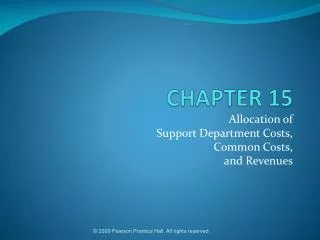
Lower Costs While Increasing Profitability? Yes You Can!. Ted Garrison New Construction Strategies Ted@TedGarrison.com www.TedGarrison.com 800-861-0874. What’s the Biggest Source of Lost Productivity?. Waste!. Amount of Waste . Value Added 10%. Waste – 57%. Support Activity 33%.

E N D
Lower Costs While Increasing Profitability? Yes You Can! Ted Garrison New Construction Strategies Ted@TedGarrison.com www.TedGarrison.com 800-861-0874
Amount of Waste Value Added 10% Waste – 57% Support Activity 33%
Defects – anything that doesn’t work Waiting –Liska report says 20% of loss productivity Over production– storing in warehouse or estimating errors Transportation – unnecessary loading or moving materials Motion – searching for stuff Over processing– duplicate forms or unnecessary reports Inventory – unused stuff only clutters work space Untapped employee creativity– potentially the worst Stress/Over burden – it just zaps our energy Unevenness/variation – destroys long-term productivity 10 Types of Waste
Chase Up™ The 11th form of waste – Chase Up™! How much time do you spend chasing people?
Reliability Which weighs heavier on a project in terms of reliability? The reliability of people to make and keep promises? Or The reliability of stuff?
One of my radio guests, Ed Anderson, coined the expression – Chase-Up™! NCS Radio (www.NCS30.com) interview: www.jackstreet.com/jackstreet/WCON.AndersonE2.cfm He defines Chase-Up™ as “the act of checking over and over again the progress of a commitment or promise by either contacting other people, or directly inspecting the works to determine the progress.” Some call it: follow-up, inspecting, expediting How much time are you wasting? What could you do with that saved time? Chase-Up™
Day-in and day-out, what is the average % of your time spent chasing the progress of commitments made to you? ________ What % of your time is spent being chased by others? ________ Obviously this is so important that everyone has been formally trained on how best to chase-up. So, what are the top three best practices of Chase-Up™ taught in your class? Chase-Up Syndrome™
Let’s say we can reduce Chase-Up™ by 10% If average worker earns $75,000 – that equals a $7,500 savings per worker or increased profitability If you have 10 people – you could eliminate one What are you going to do with all that extra time? Be more productive? Improve planning to reduce the schedule? Improve quality? Are you satisfied with your safety progress? Chase-Up Syndrome™
Cost, schedule, quality, & safety are a reflection of: Reliability! Reliability to make and keep commitments, which allows Reliable planning and production Chase-Up Syndrome™
Chase-Up™ adds no value! We can agree that some external discipline (chasing) must be applied – but how much? If Chase-Up™ doesn’t guarantee lower costs, faster schedules, higher quality, improved safety, what does it guarantee? Higher costs and we don’t even know how much more because we don’t measure Chase-Up™! Chase–Up Syndrome™
Ten slabs need to be placed first thing Friday morning! Your electricians have agreed to complete all imbedded slab work by close of business Thursday! Electricians lied – they hid a buffer! You lied because you asked for it sooner than you needed! This creates inefficiency! Which crews would require the most Chase-Up™? You don’t know! Example
Compare 2 subs: one 40% reliable, the other 90% Which one do you chase the most? On a typical project, how long does it take to establish a contractor’s reliability? Would it be worthwhile to reduce that time to days, and to be able to measure it objectively? If “YES”, HOWdo we measure the “Reliability of People to make and keep commitments” objectively? Example
We had 10 slabs to get ready Of those, let’s say 6 were completed 100% The remaining 4 were 95% complete Did they meet their commitment – yes or no? Therefore, their CRI (Commitment Reliability Index) is: 60% Is this a fair evaluation? Example
How do we normally pay people? Earned value – which is measure by productivity EV = $9,800 [6 x $1000 x 100% = $6000] + [4 x $1000 x 95% = $3800] = $9800 Let’s turn things on its head and ask: What if we paid people based on reliability first and productivity second? Do you think that would change performance? Reliability payment: $6000 [6 x $1000 x 100% = $6000] + [4 x $1000 x 0% = $0] = $6000 Example
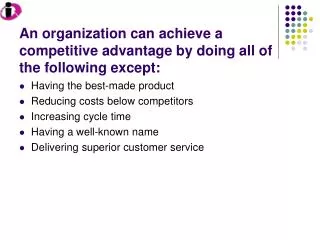
CRI (Commitment Reliability Index) – Case Study • Before action was taken on learning • CRI trend was slightly positive – 45% to 48% • Variance around trend line significant Tells us we are not very reliable, but doesn’t tell us what to do!
If someone doesn’t meet his commitment get them to define the reason in as few words as possible This isn’t a reprimand – it’s about identifying the problem Chart the problems in a histogram Identify the Problem Case Study
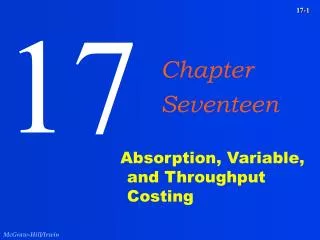
Chart the Problem – Case Study Tells us we are not very good at planning & coordination, but doesn’t tell us what to do about the problems! Pareto Principle indicates 20% of the issues will cause 80% of the problems!
Root Cause – Case Study Category Root Cause Task ID Date *1 *1 *1 *2 *2 *2 *2 *1
Commitment Reliability Index (CRI) Case Study CRI trend was slightly positive (45% - 48%) Variance around trend line is sizable and trend lag on the low side (less reliable) CRI trends very positive (49% to 84%) Variance around trend line is less than before , and trends on the high side (more reliable)
Weekly/daily production control & commitments After getting weekly commitment – need to capture daily actions Monday Morning: What are you going to do this week? Tuesday Morning: Did you do what you said you were going to do yesterday? If not, Then why not in as few words as possible Categorize (weather, planning, coordination, materials…) What are you going to do today? Repeat process the rest of the week! Applying the Application
Of 10 slab preparations committed to be completed: 6 are 100% completed – 4 are 95% completed CRI = Actual # completed/Total # committed to 6/10 = 60% A measure of reliability to: Make & keep commitments To plan & execute: “Did you do what you said you were going to do?” Not a measure of productivity or production What do you think is the average CRI on a non-lean project when first measured? 55% Review of CRI & Chase-Up™
Final Thoughts • Planning is critical for improved performance – but without reliability it’s impossible to plan • Most people are trying to do their job - so help them to remove the obstacles to doing their job • Get rid of or avoid those that don’t want to fix the reliability issues • This is something you can implement immediately and get immediate results • So what’s stopping you?
Lower Costs While Increasing Profitability? Yes You Can! Ted Garrison New Construction Strategies Ted@TedGarrison.com www.TedGarrison.com 800-861-0874