Download
1 / 73
730 likes | 853 Vues
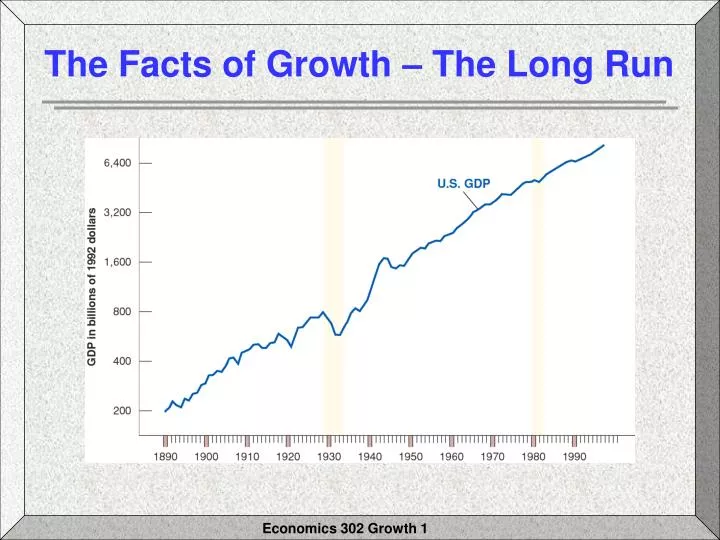
The Facts of Growth – The Long Run. The Facts of Growth – The Long Run. Annual Growth Rate Real Output per Capita Output per Capita (%) (1992 dollars). Ratio of Real Ouput Per Capita 1950-1973 1973-1998 1950 1998 1998/1950. France 4.2 1.6 5,150 19,158 3.7

E N D
The Facts of Growth – The Long Run Annual Growth Rate Real Output per Capita Output per Capita (%) (1992 dollars) Ratio of Real Ouput Per Capita 1950-1973 1973-1998 1950 1998 1998/1950 France 4.2 1.6 5,150 19,158 3.7 Germany 4.9 1.8 4,356 20,059 4.6 Japan 8.1 2.5 1,820 19,907 10.9 United Kingdom 2.5 1.9 6,870 19,005 2.8 United States 2.2 1.5 11,170 25,890 2.3 Average 4.4 1.9 5,872 20,804 3.5
Output Per Capita = The Facts of Growth – The Long Run Constructing Output Numbers Purchasing Power Parity: Adjusts for differences in exchange rates and prices
The Facts of Growth – The Long Run Observations • Strong growth 1950-2001 • Growth rates have decreased since the mid 1970s 1950-1978 4.4% (GDP/capita doubles every 16 years) 1973-2001 1.9% (GDP/capita doubles every 37 years) • Convergence in output/capita across countries
The Facts of Growth – The Long Run Convergence in Output/Capita
The Facts of Growth – The Long Run What do you think… Could the finding of convergence beinfluenced by the way the countries areselected?
The Facts of Growth – The Long Run A Broader Look Across Time and Space • Looking across two millennia • From the end of the Roman Empire to 1500, no output per capita growth in Europe • 1500-1700 -- Small growth in output per capita (0.1%/year and 0.2%/year 1700 to 1820) • 1820-1950 -- Modest growth (U.S. = 1.5%) • The high-growth of the 1950s and 1960s is unusual
The Facts of Growth – The Long Run A Broader Look Across Time and Space • Looking across two millennia (Continued) • 1st Millennium to the 15th century, China had the highest output/capita • Leaders in output/capita change frequently: Italy Netherlands U.K.
Amount Percent ofItem of Expenditure (Dollars) Total Butcher’s meat (2 lb a day) 72.80 13.5 Flour (6 1/2 lb a year) 32.50 6.0Butter (2 lb a week) 32.50 6.0Potatoes (2 pk a week) 26.00 4.8Sugar (4 lb a week) 16.64 3.0Coffee and tea 13.00 2.4Milk 7.28 1.4Salt, pepper, vinegar, starch, soap, yeast, cheese, eggs 20.80 3.9 Total expenditure for food 221.52 41.0Rent 156.00 29.0Coal (3 tons a year) 15.00 2.8Charcoal, chips, matches 5.00 0.9Candles and oil 7.28 1.4Household articles (wear, tear, and breakage) 13.00 2.4Bedclothes and bedding 10.40 1.9Wearing apparel 104.00 19.3Newspapers 6.24 1.2 Total expenditures other than food 316.92 58.9 The Facts of Growth – The Long Run The Reality of Growth: A Workingman’s Budget in 1851
The Facts of Growth – The Long Run Looking Across Countries – Convergence Not the Rule
The Facts of Growth – The Long Run Looking Across Countries – A Closer Look
The Facts of Growth – The Long Run Looking Across Countries – A Closer Look Three Conclusions: • OECD countries are converging • Asian countries are converging • African countries are not converging
The Facts of Growth – The Long Run Looking Across Countries – A Closer Look Growth Miracles vs Growth Disasters • Miracles: Japan + Asian Tigers • (South Korea, Taiwan, Singapore, Hong Kong) • (average annual growth of over 5% 1960-1990) • Disasters: Argentina (average income in 1900 • Similar to those of world leaders; now middle of • World income distribution) • Disaster: Sub-saharan Africa (Chad, Ghana, • Mozambique) extremely poor throughout history
The Facts of Growth – The Long Run A Summary 1. Growth is not a historical necessity 2. Convergence of OECD countries to the U.S. may be the prelude to leapfrogging 3. The rapid post WWII growth was atypical
The Facts of Growth – The Long Run Thinking About Growth: A Primer (The Solow Model) The Aggregate Production Function Y = F (K, N) Y = Aggregate Output K = Capital N = Labor
The Facts of Growth – The Long Run The Aggregate Production Function Y = F (K, N) F: Depends on technology
The Facts of Growth – The Long Run Returns to Scale and Returns to Factors Constant returns to scale: 2Y = F(2K,2N)xY = F(xK,xN) • Decreasing returns to factors (capital & labor): • Increases in K and N lead to smaller and smaller increases in output
The Facts of Growth – The Long Run Output and Capital per worker
The Facts of Growth – The Long Run Output and Capital per worker
Y/N = (K/N, 1) D´ C´ B´ A´ C A B D The Facts of Growth – The Long Run Output and Capital per worker Output per worker, Y/N Capital per worker, K/N
F(K/N, 1) F(K/N, 1) B´ A´ Output per worker, Y/N A Capital per worker, K/N The Facts of Growth – The Long Run The Sources of Growth • An improvement in technology shifts • the production function up
Increases in occur when technology shifts the production functions The Facts of Growth – The Long Run The Sources of Growth
The Facts of Growth – The Long Run The Sources of Growth • Capital Accumulation • Cannot sustain growth because of diminishing returns to capital • Capital accumulation requires savings, therefore, what is the appropriate savings rate?
The Facts of Growth – The Long Run The Sources of Growth • Technological Progress • Required for sustained growth • What determines the rate of technological progress?
The savings rate since 1950 Saving, Capital Accumulation, and OutputThe Long Run Observation: U.S. 18.6%Germany 24.6%Japan 33.7% What do you think… Would increasing the U.S. savings rate lead to sustained higher U.S. growth in the future?
Interactions between Output and Capital Two long-run relations between output and capital • The amount of capital determines the amount of output being produced • The amount of output determines the amount of savings and investment and, thus, the amount of capital
Interactions between Output and Capital Capital, Output, and Saving/Investment
output per worker capital per worker Interactions between Output and Capital The Effects of Capital on Output
Interactions between Output and Capital The Effects of Capital on Output Two assumptions: • Employment (N) is constant • There is no technological progress (f is constant) Therefore:
Interactions between Output and Capital The Effects of Output on Capital Accumulation Output & Investment Three assumptions: • Closed economy: I = S + (G-T) • I = S if G = T = 0, therefore (G-T)=0 • S = sY: Private saving is proportional to incomes = Savings rate (between 0 & 1)
It = sYt Output & Investment Interactions between Output and Capital The Effects of Output on Capital Accumulation Observations • The savings rate does not appear to systematically increase or decrease as Y increases • Richer countries do not appear to have systematically higher savings rates than poorer ones • Investment is proportional to output
Kt+1 = (1- ) Kt + It = the depreciation rate Interactions between Output and Capital The Effects of Output on Capital Accumulation Investment and Capital Accumulation The evolution of the capital stock:
Kt+1 = (1- ) Kt + It and It = sYt Kt+1 = (1- ) Kt + sYt and ÷ N Interactions between Output and Capital The Effects of Output on Capital Accumulation Investment and Capital Accumulation The relation between output and capital accumulation
Interactions between Output and Capital The Effects of Output on Capital Accumulation Investment and Capital Accumulation The relation between output and capital accumulation Capital/worker in t+1 = Capital/Worker in t, adjusted for depreciation and investmentInvestment/worker = Savings rate x Output/worker in t
Reorganizing: Savings/worker - depreciation Change in Interactions between Output and Capital The Effects of Output on Capital Accumulation Investment and Capital Accumulation The relation between output and capital accumulation
Capital-Output Relation: Output-Capital Relation: Interactions between Output and Capital A Summary The Production Side
Given: And: Implications of Alternative Saving Rates Dynamics of Capital and Output
Given: - = Change in capitalfrom year t to year t+1 Invest-ment during year t depreciationduring year t Implications of Alternative Saving Rates Dynamics of Capital and Output
Implications of Alternative Saving Rates Dynamics of Capital and Output The change in capital/worker from t to t+1 depends on the difference between: Investment/Worker & Depreciation/Worker
Implications of Alternative Saving Rates Dynamics of Capital and Output Capital/Worker increases: Investment/Worker > Depreciation/Worker Capital/Worker decreases: Investment/Worker < Depreciation/Worker
Depreciation per worker Kt/N Output per worker f(Kt/N) Y*/N B Investment per worker sf(Kt/N) C D A Implications of Alternative Saving Rates Dynamics of Capital and Output Graphically Output per worker, Y/N AB = Output/worker AC = Investment/worker AD = Depreciation AC > AD (Ko/N) K*/N Capital per worker, K/N
The evolution of & over time is low, therefore I > depreciation ( ) If I > , increases until I = When I = : & remain constant @ Long-run equilibrium Implications of Alternative Saving Rates Dynamics of Capital and Output Assume:
Steady-State Value of Capital/Worker Steady-State Value of Output/Work Implications of Alternative Saving Rates Steady-State Capital and Output
Implications of Alternative Saving Rates The Saving Rate and Output What are the effects of the saving rate on the rate of output per worker? • The saving rate has no effect on the long run growth rate of output/worker, this is equal to zero. • The saving rate determines the level of output/worker in the long run. • An increase in the saving rate will lead to a higher growth of output/worker for some time, but not forever.
Depreciation per worker Kt/N Investment s0f(Kt/N) Investment s1f(Kt/N) Output per worker, Y/N (K0/N) K1/N Capital per worker, K/N Implications of Alternative Saving Rates The Effects of Different Saving Rate
Depreciation per worker Kt/N Output per worker f(Kt/N) D Y1/N B Investment s0f(Kt/N) Investment s1f(Kt/N) Y0/N C I > Output per worker, Y/N A (K0/N) K1/N Capital per worker, K/N Implications of Alternative Saving Rates The Effects of Different Saving Rate
Y1/N Output per worker, Y/N Y0/N Time Implications of Alternative Saving Rates The Effects of Different Saving Rate (No technological progress) Associated with saving rate s1 > s0 Associated with saving rate s0 t
Associated with saving rate s1 > s0 Output per worker, Y/N (log scale) Associated with saving rate s0 Time Implications of Alternative Saving Rates The Effects of Different Saving Rate (Technological progress) t
Implications of Alternative Saving Rates The Savings Rate and the Golden Rule Does an increase in saving lead to an increase inconsumption in the long run? Two Scenarios: • Saving Rate = 0 • Capital = 0 • Output = 0 • Consumption = 0 • Saving Rate = 1 • Consumption = 0 • Output replaces depreciation
Implications of Alternative Saving Rates The Savings Rate and the Golden Rule The Golden-Rule Level of Capital: The value of saving that yields the highestlevel of consumption in steady state.