Download
1 / 10
100 likes | 108 Vues
SeaWinds AMSR-derived Impact Table. Jan 17, 2006 Bryan Stiles and R. Scott Dunbar. Impact Table Overview. Speed Bias and Cross Track Directional Bias are tabularized by: Attenuation Backscatter ratio B/ 0 Cross Track Distance Average outer beam measured 0

E N D
SeaWinds AMSR-derived Impact Table Jan 17, 2006 Bryan Stiles and R. Scott Dunbar
Impact Table Overview • Speed Bias and Cross Track Directional Bias are tabularized by: • Attenuation • Backscatter ratio B/ 0 • Cross Track Distance • Average outer beam measured 0 • Cross track bias is computed for Scatterometer-only DIRTH w.r.t NCEP • Speed Bias is computed similarly below a 0 threshold but is computed directly from A and B above the threshold.
To compute speed impacts at high winds we: • Estimate retrieved wind speed from average measured s0. (using QSCAT1) • An estimate of speed is derived for each beam. • An average value is computed weighted by the number of measurementsfrom each beam. • Estimate true wind speed similarly from s0s corrected using A and B. • Compute the difference between the two speeds. • Accumulate difference for each WVC in SWS mission into bins in speed impact table. • This resulting table is the GMF-derived table.
Why do we compute Speed Impact two different ways? • The two methods agree well for moderate wind speeds (7-15 m/s). • The A, B model of rain impact on s0 was estimated as a function of liquid, vapor, SST, and beam. • To obtain agreement between the A, B model and the NWP speed biases at high winds. • Rain backscatter would have to be a increasing function of wind speed. AND/OR • Attenuation would have to decrease with wind speed. • Because the required changes in A, B seem counterintuitive, we conclude that the NWP speed winds are systematically biased low for cases with high wind speed and high liquid. • This could be explained by rain correlating with small scale high wind regions, poorly represented by low resolution NWP fields. • For this reason we do not want to use NCEP speed impacts for high winds.
At low wind speeds computing speed impact directly from A and B overestimates speed impact. • Why? • Errors in liquid estimate. • Cases of truly high liquid and low measured s0 do not occur. • Some bins in impact table are populated solely by the high end of the liquid error distribution. • Errors in backscatter, B, estimate • For very low winds where rain-free s0< -25 dB, B estimates cannot meet the required precision to correct the speeds well. • Solution? • New table using NCEP-derived impact for average outer beam measured s0 < 0.021. • O.021 is the 99.9 percentile of the B value.
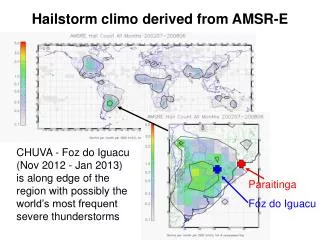
Speed impact as originally derived by SWS-NWPHigh wind biases are wrong due to NCEP error
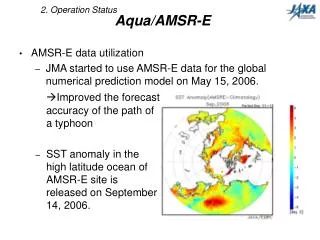
Speed Biases Computed from A and BLow wind biases are wrong due to errors in liquid and B