Download
1 / 1
10 likes | 109 Vues
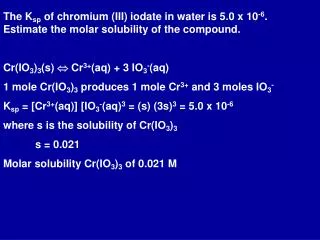
Aerosol-Precipitation Responses Deduced from Ship Tracks as Observed by CloudSat Matthew W. Christensen 1 and Graeme L. Stephens 2 Department of Atmospheric Sciences, Colorado State University 1 Jet Propulsion Laboratory, California Institute of Technology 2. Cloud Top Altitude Response.

E N D
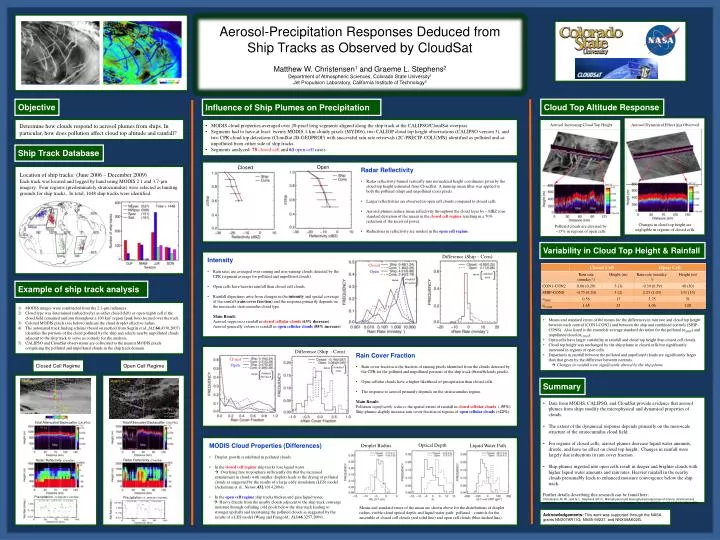
Aerosol-Precipitation Responses Deduced from Ship Tracks as Observed by CloudSat Matthew W. Christensen1 and Graeme L. Stephens2 Department of Atmospheric Sciences, Colorado State University1 Jet Propulsion Laboratory, California Institute of Technology2 Cloud Top Altitude Response Objective Influence of Ship Plumes on Precipitation Determine how clouds respond to aerosol plumes from ships. In particular, how does pollution affect cloud top altitude and rainfall? • MODIS cloud properties averaged over 20-pixel long segments aligned along the ship track at the CALIPSO/CloudSat overpass. • Segments had to have at least: twenty MODIS 1-km cloudy pixels (MYD06), two CALIOP cloud top height observations (CALIPSO version 3), and two CPR cloud top detections (CloudSat 2B-GEOPROF) with successful rain rate retrievals (2C-PRECIP-COLUMN) identified as polluted and as unpolluted from either side of ship tracks. • Segments analyzed: 78 closed cell and 61 open cell cases. Aerosol Increasing Cloud Top Height Aerosol Dynamical Effect Not Observed Ship Track Database Open Closed • Radar Reflectivity • Radar reflectivity binned vertically into normalized height coordinates given by the cloud top height estimated from CloudSat. A running mean filter was applied to both the polluted (ship) and unpolluted (con) pixels. • Larger reflectivities are observed in open cell clouds compared to closed cells. • Aerosol plumes reduce mean reflectivity throughout the cloud layer by ~3dBZ (one standard deviation of the mean) in the closed cell regime resulting in a 50% reduction of the received power. • Reductions in reflectivity are modest in the open cell regime. Location of ship tracks: (June 2006 – December 2009) Each track was located and logged by hand using MODIS 2.1 and 3.7-μm imagery. Four regions (predominately stratocumulus) were selected as hunting grounds for ship tracks. In total, 1448 ship tracks were identified. Changes in cloud top height are negligible in regions of closed cells Polluted clouds are elevated by ~15% in regions of open cells Variability in Cloud Top Height & Rainfall Difference (Ship – Cons) • Intensity • Rain rates are averaged over raining and non-raining clouds detected by the CPR (segment average for polluted and unpolluted clouds). • Open cells have heavier rainfall than closed cell clouds. • Rainfall departures arise from changes in the intensity and spatial coverage of the rainfall (rain cover fraction) and the response primarily depends on the mesoscale stratocumulus cloud type. • Main Result: • Aerosol suppresses rainfall in closed cellular clouds (63% decrease) • Aerosol generally enhances rainfall in open cellular clouds (88% increase) Closed Open standard error mean standard deviation mean Example of ship track analysis • MODIS images were constructed from the 2.1-μm radiances. • Cloud type was determined (subjectively) as either closed (left) or open (right) cell if the cloud field remained uniform throughout a 100 km2 region (pink box) located over the track. • Colored MODIS pixels (see below) indicate the cloud droplet effective radius. • The automated track finding scheme (based on method from Segrin et al.,JAS,64,4330,2007) identifies the portions of the cloud polluted by the ship and selects nearby unpolluted clouds adjacent to the ship track to serve as controls for the analysis. • CALIPSO and CloudSat observations are collocated to the nearest MODIS pixels comprising the polluted and unpolluted clouds in the ship track domain. • Means and standard errors of the means for the differences in rain rate and cloud top height between each control (CON1-CON2) and between the ship and combined controls (SHIP-CONS). Also listed is the ensemble average standard deviation for the polluted (σSHIP) and unpolluted cloud (σCONS). • Open cells have larger variability in rainfall and cloud top height than closed cell clouds. • Cloud top height was unchanged by the ship plume in closed cells but significantly increased in regions of open cells. • Departures in rainfall between the polluted and unpolluted clouds are significantly larger than that given by the difference between controls. • Changes in rainfall were significantly altered by the ship plume. Difference (Ship – Cons) • Rain Cover Fraction • Rain cover fraction is the fraction of raining pixels identified from the clouds detected by the CPR for the polluted and unpolluted portions of the ship track (#rain/#clouds pixels). • Open cellular clouds have a higher likelihood of precipitation than closed cells. • The response to aerosol primarily depends on the stratocumulus regime. • Main Result: • Pollution significantly reduces the spatial extent of rainfall in closed cellular clouds (-55%) • Ship plumes slightly increase rain cover fraction in regions of open cellular clouds (+22%) Closed Open Cell Regime Closed Cell Regime Open standard error mean standard deviation mean Summary MODIS: 2.1-μm MODIS: 2.1-μm • Data from MODIS, CALIPSO, and CloudSat provide evidence that aerosol plumes from ships modify the microphysical and dynamical properties of clouds. • The extent of the dynamical response depends primarily on the mesoscale structure of the stratocumulus cloud field. • For regions of closed cells, aerosol plumes decrease liquid water amounts, drizzle, and have no affect on cloud top height. Changes in rainfall were largely due reductions in rain cover fraction. • Ship plumes ingested into open cells result in deeper and brighter clouds with higher liquid water amounts and rain rates. Heavier rainfall in the nearby clouds presumably leads to enhanced moisture convergence below the ship track. • Further details describing this research can be found here: • Christensen, M. W., and G. L. Stephens (2011), Microphysical and macrophysical responses of marine stratocumulus • polluted by underlying ships: Evidence of cloud deepening, J. Geophys. Res., 116, D03201, doi:10.1029/2010JD014638. CALIPSO Orbit Ship Control 1 Control 2 Total Attenuated Backscatter (CALIPSO) Total Attenuated Backscatter (CALIPSO) 532 nm 532 nm • MODIS Cloud Properties (Differences) • Droplet growth is inhibited in polluted clouds. • In the closed cell regime ship tracks lose liquid water. • Overlying free troposphere sufficiently dry that the increased entrainment in clouds with smaller droplets leads to the drying of polluted clouds as suggested by the results of a large eddy simulation (LES) model (Ackerman et al., Nature,432,1014,2004). • In the open cell regime ship tracks thicken and gain liquid water. • Heavy drizzle from the nearby clouds adjacent to the ship track converge moisture through colliding cold pools below the ship track leading to stronger updrafts and moistening the polluted clouds as suggested by the results of a LES model (Wang and Feingold., JAS,66,3257,2009). Optical Depth Droplet Radius Liquid Water Path Radar Reflectivity (CloudSat) Radar Reflectivity (CloudSat) Precipitation (2C-PRECIP-COLUMN) Precipitation (2C-PRECIP-COLUMN) Means and standard errors of the mean are shown above for the distributions of droplet radius, visible cloud optical depth, and liquid water path: polluted – controls for the ensemble of closed cell clouds (red solid line) and open cell clouds (blue dashed line). Acknowledgements: This work was supported through the NASA grants NNX07AR11G, NAS5-99237, and NNX09AK02G.