Download
1 / 30
300 likes | 423 Vues
A PERFORMANCE ANALYSIS MODEL OF ORDER PICKING WAREHOUSE DESIGN for TRANSPORTERS. 2005. 10. 29. 2005 ’ 倉儲系統與物料搬運 研 討會 逢甲大學工業工程與系統管理學系. 黃 興 錫 (Heung Suk Hwang) Department of Business Management , Kainan University, Taiwan e-mail : hshwang@mail.knu.edu.tw. Kainan University.

E N D
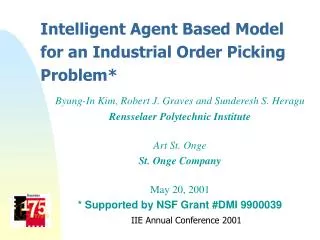
A PERFORMANCE ANALYSIS MODEL OF • ORDER PICKING WAREHOUSE DESIGN • for TRANSPORTERS 2005. 10. 29. 2005’倉儲系統與物料搬運研討會 逢甲大學工業工程與系統管理學系 黃 興 錫 (Heung Suk Hwang) Department of Business Management , Kainan University, Taiwan e-mail : hshwang@mail.knu.edu.tw Kainan University
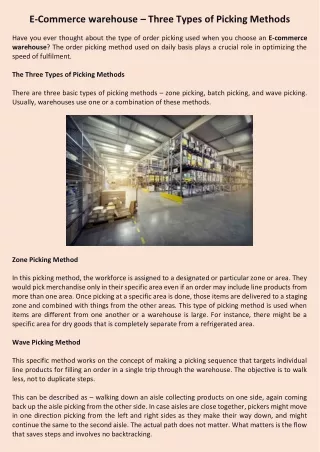
Contents • 1. INTRODUCTION • 2.ORDER PICKING WAREHOUSE SYSTEM • 3.SIMULATION MODEL FOR ORDER PICKING • WAREHOUSE SYSTEM ANALYIS • 4. SUMMARY AND CONCLUSIONS • ☞ Demonstrate a Hyundai W-Car Problem Kainan University
1. Introduction • ☞ Developed a performance evaluation model for order picking • warehouse in supply center(SC) by reducing the travel distance • of transporters • ☞We developed a two-step approach : • - a mathematical model • - a simulation model using AutoMod simulator • ☞ Also we developed computer program and demonstrated the pro • posed methods, • ☞ Then we carryout numerical studies to compare the system • performance improvement over the number of transporter in order • picking warehouse. Kainan University
☞ The major functions of the freight terminal system are : 1) Pickup and arrival, 2) Auto-sensing the freight information, 3) Auto-sorting, and 4) Delivery. Kainan University
Figure 1. Operating Cost Ratio of . General Warehouse Kainan University
Figure 2. Two-Step Approach of Order Picking Warehouse System Kainan University
Getting the Information Getting the Information Getting the Information Getting the Information of Goods of Goods of Goods of Goods Arriving(Strip Door) Arriving(Strip Door) Arriving(Strip Door) Arriving(Strip Door) Order picking warehouse - Information System - Pickup, sort, and delivery * Transfers the product to customers Order picking Transport/Sorting Delivering(Stack Door) Delivering(Stack Door) Delivering(Stack Door) Delivering(Stack Door) Distribution Distribution Distribution Distribution 2. Order Picking Warehouse System Figure 1. Freight Flow in Freight Terminal Kainan University
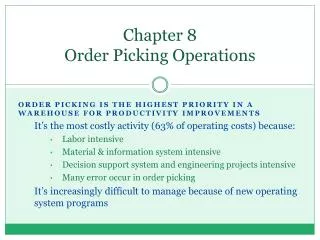
Transport Path Picking Point I/O Dock
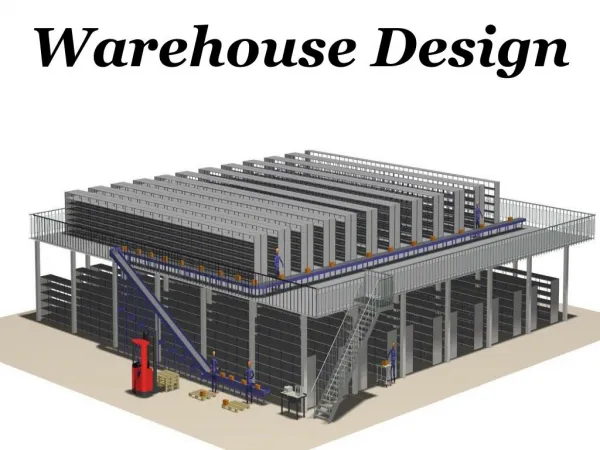
Figure 4. General Layout of Picking Warehouse Kainan University
2.1 Probabilistic Picking in Warehouse • We assumed that an item found in the i th aisle has the probability, • This is proportional to the average of the turn over rate of all items found in a aisle • or the number or racks for an item. • Notations used : • M : number of freight of an item, • : number of item stored in the ware house • : probability of picking item • m : number of item stored in the ware house • = number of item 1 • n : number of picking of order or • : number of picking of each items per an order picking, Kainan University
Prob ( picking n items in the warehouse where stored k items) = (1) where, means the probability of picking item in a picking. All the cases of picking of item k when a transporter repeats n times of picking with the probability , is given by, ( 2) Kainan University
The expected number of picking by a transporter : (3) • By the assuming that the probability that a pick comes from a randomly • selected zone is 1/p • where p is number of transporters or number of zones. • Thus the expected number of picks in pf a transporter or zone during a • particular time period can be approximated using the binomial distribution • The upper limit of picking UL(the number of items retrieved by a • transporter) can be determined by using the normal distribution to • approximate the binomial distribution. as following • The binomial distribution B(n, p) can be approximate as • N(np, np(1-p)) Kainan University
Thus, = Kainan University
2.2 Optimal Size of Unit Rack Notations : AW : width of unit aisle(ft) AL : length of unit aisle(ft) LW : width of unit rack(ft) LL : length of unit aisle(ft) LH : width of unit aisle(ft) WM : number of aisle R : required through put( unit/hr or day) C : total length of rack(ft) TA : available space of system, VHV: horizontal speed of transporter(ft/hr) VVV : vertical speed of transporter(ft/hr) T : scale parameter of unit rack T: LL/VHV= LH/VVV
We formulate this problem as following : Min. WM St 2·LW·LH·WM = C (1) (AW + AL) ·((LW + LL) · WM + 1) = TA where, TU is given by following Eq. (2) (2) By Eq. 1 and 2, (3) and by Eq, 2 and 3, where, Kainan University
The algorithm to find WM is given by following 5 steps : step 1 : step 2 : if , go to step -4 Otherwise, go to step-3 step-3 : , go to step-2 step-4 : stop , WM = minimum number of aisle, Kainan University
We could find optimal size of aisle and the system performance as following : - number of aisle : WM - height of rack : - length of rack : - expected travel time(min) : - system utilization rate(%): utilization rate Kainan University
Numerical example to find WM and system utilization rate : S = , R = 294 picks n = 5 picks/trip, p = 0.25 Min/pick hv = 150 m/min, vv = 30 m/min k = 1.25 min/trip Number of aisle = 3 Height of rack = 4.1m Length of rack = 20.6m Expected Travel Time = 2.83 System Performance = 92.52% Kainan University
2.3 Travel Time Analysis Assumptions : - one picker in each zone, - each type of item in stored in one location, - sufficient supply of items in at each location, - items are picked along one side of an aisle at a time, - there are two sides to each aisle , - transporters travels through all the aisles, - items are randomly assigned to storage location within a facility, The total processing time : 1) The picking time is given by following equation : where, TN : number of transporter, : time for a transporter to pickup an item : number of all the items picked up by transporter, Kainan University
2) Traveling time : 3) Stop time for picking : Total process time per travel of transporter) = (picking time) + (traveling time) + (Stop time for each SHU Kainan University
4) Determining of the optimal number of transporters - dependent on total process time, number of aisle, its length and number of required amount to be retrieved. - It is very complicated problem Thus, we used a simulation method based on AutoMod simulator. Kainan University
Simulation Model for Order Picking • Warehouse System Analysis • We modeled the same order picking warehouse system using • AutoMod simulator. • We have run the simulation for 1000hours with following design • parameters : • Number of aisle = 3, • height of rack = 4.1m, • length of rack = 20.6m, • C = 539 m2 , R = 294 picks, n = 5 picks/trip, • p = 0.25 Min/pick, vhv = 150 m/min, vvv = 30 m/min, • k = 1.25 min/trip Kainan University
Case 1 : Number Transporter = 1 Kainan University
Case 2 : Number Transporter = 2 Kainan University
Alter. of Trans Delivering Retrieving Parking Per. of Total time Trips Made Average time sec/trip Per. of total time Trips made Av. time /trip Per. of Total time 1 50.0% 34.65 52.2 50% 34.65 52.2 0 2 53.5% 31.34 61.8 46.5% 31.34 53.4 0 3 60.9% 26.27 83.4 39.1% 26.27 53.4 0 4 66.4% 19.61 121.8 33.6% 19.61 61.8 0 5 28.1% 28.82 350.4 71.9% 28.84 893.4 0 6 34.7% 5.85 2139.6 65.3% 5.88 4008 0 Table 1. Transporter Performance
Alter. of Transporter (No. of Transporter) Total Throughput Warehouse Utilization (%) 1 138.3 55.2 2 250.3 59 3 311.8 61.3 4 311.1 61.2 5 57.1 52.4 6 13.7 50.1 Table 2. Material handling flows(Amount of throughput) Kainan University
Figure 4. Total Throughput per Alternative of Transporter Kainan University
Sample problem of order picking systems - The picking utilization obtained from mathematical model is a little greater than that from simulation (92.52 > 61.3) - the optimal number of transporter : 3 - total throughput : 311.8. - There should be a minimum two line spaces between tables and - text. Kainan University
4. Conclusion - In this paper, we have presented an analysis for order picking systems by two-step approaches in this paper, mathematical and simulation model using AutoMod. - An algorithm for end-of-aisle is developed. - We have developed a computer program for the analytical method. - Computational results are presented on the relative performance of each type of methods. - These approaches have been compared with each other in terms of utilization of pickers, total throughput and handling time. Kainan University
Thank You Kainan University, Taiwan Prof. Heung-Suk Hwnag Kainan University