Download
1 / 39
390 likes | 1.14k Vues
Internal Validity. Measured & Manipulated Variables & Constants Causes, Effects, Controls & Confounds Components of Internal Validity Interrelationships between Internal Validity & External Validity “Creating” initial equivalence “Maintaining” ongoing equivalence.

E N D
Internal Validity • Measured & Manipulated Variables & Constants • Causes, Effects, Controls & Confounds • Components of Internal Validity • Interrelationships between Internal Validity & External Validity • “Creating” initial equivalence • “Maintaining” ongoing equivalence
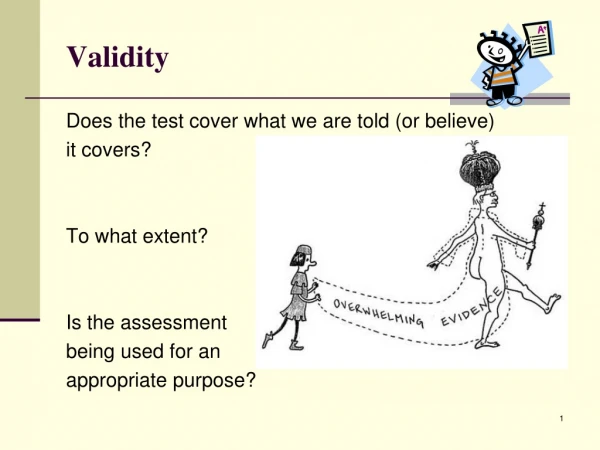
Name the three types of research hypotheses and tell the evidence for @ Attributive -- can measure the behavior and discriminate it from other similar behaviors Associative -- demonstrate a reliable statistical relationship between the behaviors Causal -- temporal precedence (cause precedes effect) -- reliable statistical relationship between the behaviors -- no confounds or alternative explanations of the relationship What are the components of External Validity 1. 2. 3. 4. Name the four types of validity … 1. 2. 3. 4. Measurement Statistical conclusion Internal External Population Task / Stimulus Situation Social / Temporal
Internal Validityis about Causal Interpretability Before we can discuss Internal Validity, we have to discuss different types of variables and review causal RH:s and the evidence needed to support them… Every behavior/measure used in a research study is either a ... Constant -- all the participants in the study have the same value on that behavior/measure or a ... Variable -- when at least some of the participants in the study have different values on that behavior/measure and every behavior/measure is either … Measured -- the value of that behavior/measure is obtained by observation or self-report of the participant (often called“subject constant/variable”) or it is … Manipulated -- the value of that behavior/measure is controlled, delivered, determined, etc., by the researcher (often called “procedural constant/variable”)
So, every behavior/measure in any study is one of four types…. constant variable measured manipulated measured (subject) constant measured (subject) variable Manipulated (procedural) variable manipulated (procedural) constant • Identify each of the following (as one of the four above, duh!)… • Participants reported practicing between 3 and 10 times • All participants were given the same set of words to memorize • Each participant reported they were a Psyc major • Each participant was given either the “homicide” or the “self- defense” vignette to read
quick review ofCausal Research Hypotheses: • From before... • Causal RH: -- differences in the amount or kind of one behavior causes/produces/creates/changes/etc. differences in amount or kind of the other behavior • Using our newly acquired language… • Causal RH: -- the value of the variable manipulated by the researcher causes the value of the variable measured from the participant • In a causal research hypothesis… • the manipulated variable = the “causal variable” • the measured variable = the “effect variable,” the “response variable” or the “outcome variable” Be sure to notice -- The “causal variable” absolutely must be manipulated in the study !!!!
Circle the manipulated/causal & underline measured/effect variable in @ • Practice improves performance. • Treatment decreases depression. • Schizophrenic symptomology is decreased by pharmacological intervention • Reading speed is improved by larger print size. • Practice improves performance. • Treatment decreases depression. • Schizophrenic symptomology is decreased by pharmacological intervention. • Reading speed is improved by larger print size. Try this one (you’ll have to “figure out” what the manipulated variable is from the description of the different “conditions”) Completing the group therapy will lead to lower social anxiety scores than will completing the individual therapy. manipulated variable --> Type of Therapy (group vs. individual) measured variable --> Anxiety Score
Review of evidence required to support a causal research hypothesis … • Evidence needed to support a causal hypothesis... • temporal precedence (“cause proceeds effect”) • demonstrate a statistical relationship • elimination of alternative explanations (no other viable causes/explanations of the effect) This identifies four different “roles” variables/constants might play in a study …. Causal variable -- manipulated by the researcher -- the variable to which we want to attribute the effect Effect variable -- measured from each participant after manipulation of causal variable by the researcher Confounding variable(s) -- any variable (other than the one manipulated by the researcher) that might have caused the effect -- an alternative causal variable or explanation of the effect Controls -- any constant/variable that can’t have caused the effect because it is “equivalent” across conditions
One of those things about “how we use words oddly” We often talk about two kinds of variables – like this… “Variables”– behaviors or characteristics of interest in the study Variables – behaviors or characteristics for which different participants have different values Constants – behaviors or characteristics for which all participants have the same value
Control Constants vs.Control Variables • Control Constants • any behavior or characteristic for which all participants have the same value • “a constant can’t be a confounding variable” • Control Variables • any behavior or characteristic for which participants have different values, but for which the treatment or conditions are “balanced” or “equivalent” on that variable • Examples • if ½ of the participants in each treatment/condition are male and ½ female, then gender is a control variable (note – don’t need a ½ - ½ split, only that the split is the same in each treatment/condition) • if the participants in each treatment/condition have the same average IQ, then IQ is a control variable
Control Constants, Control Variables & Confounds – some practice 80% of treatment group participants have prior experience with the task and 20% of the control group participants have prior task experience 60% of treatment group participants have prior experience with the task and 60% of the control group participants have prior task experience None of the participants in either group have prior task experience All participants are 6 years old The average age of the treatment group is 7 and the average age of the control group is 45. The average ate of the treatment group is 7.1 and the average age of the control group is 7.2, confound control variable control constants control constants confound control variable
So, to summarize ... Before the study begins... After the study is over ... Causal Variable Effect Variable Potential Confounds Causal Variable Effect Variable (Control) Constants Control Variables Confounding Variables
Let’s try using these terms … RH: Computerized spelling practice leads to better performance than does paper & pencil practice. Twenty English speaking 4th grade students were given 10 words and practiced them 5 times each on the computer. Twenty English speaking 2nd grade students were given the same 10 words and practiced them 3 times each using paper & pencil. When tested the “computer practice” students did better than the “paper & pencil practice” students Type of practice (comp.vs. pap&pen) What’s the intended causal variable? What’s the intended effect variable? Test performance Any control variables/constants & is each measured or manipulated? • English speaking – meas. const • same words -- manip. const Any confounds & is each measured or manipulated ? • grade -- measured • # practices -- manipulated So, can these results be used to support the causal RH: why or why not? NO! We have temporal precedence, we have a statistical relationship, but we also have confounds, so we can’t be sure what caused the effect
Here’s another... RH: Group therapy will lead to lower dep. scores than individual therapy Five male & five female patients with no prior therapy completed a 24-session course of group therapy, meeting each time at the university psychiatric clinic. A different group of five male & five female patients patients, each of whom had previously received therapy for depression, completed a 10-session series of individual therapy, meeting at the same clinic. After the respective therapies, the group therapy patients had lower depression scores. Type of therapy (grp vs. ind.) What’s the intended causal variable? Depression score What’s the intended effect variable? Any control variables/constants & is each measured or manipulated? • Tx location -- manipulated const. • gender -- measured var. Any confounds & is each measured or manipulated ? • # sessions -- manipulated • prior therapy -- measured So, can these results be used to support the causal RH: why or why not? NO! We have temporal precedence, we have a statistical relationship, but we also have confounds, so we can’t be sure what caused the effect
Notice that the RH: determines what’s a causal variable and a confound ! RH: More therapy sessions will lead to lower dep. scores. Five male & five female patients with no prior therapy completed a 24-session course of group therapy, meeting each time at the university psychiatric clinic. A different group of five male & five female patients patients, each of whom had previously received therapy for depression, completed a 10-session series of individual therapy, meeting at the same clinic. After the respective therapies, the group therapy patients had lower depression scores. # therapy sessions (24vs. 10) What’s the intended causal variable? Depression score What’s the intended effect variable? Any control variables/constants & is each measured or manipulated? • Tx location -- manipulated const. • gender -- measured const. Any confounds & is each measured or manipulated ? • Type of Tx -- manipulated • prior therapy -- measured So, can these results be used to support the causal RH: why or why not? NO! We have temporal precedence, we have a statistical relationship, but we also have confounds, so we can’t be sure what caused the effect
Quick review … then on to Internal Validity... • “Kinds of behaviors/measures” -- need to be able to think simultaneously with two “systems” • First, any behavior/measure in a study is one of four kinds • measured (subject) constant • measured (subject) variable • manipulated (procedural) constant • manipulated (procedural) variable • Second, each behavior/measure has one of 4 “roles” in the study • Causal variable • Effect (response, outcome) variable • Control variable/constant -- for causal interpretation, every behavior/measure not the causal or effect variable need to be “controlled” • Confounding variable -- anything other than the causal variable that might be causing “the effect’
Components of Internal Validity-- remember, Int. Val. Primarily applies when testing causal RH:-- but “cleaner” studies of associative RH: are easier to interpret Initial Equivalence • Prior to manipulation of the causal variable, participants in the different conditions are the same (on the average) on all measured/subject variables Ongoing Equivalence • during manipulation of the causal variable, completion of the task, and measurement of the effect variable, participants in the different conditions are the same (on the average) on all manipulated/procedural variables
The Relationship between Internal & External Validity • There are two different ways to think about the relationship between these two types of validity • actually they are mutually exclusive, but we seem to alternate between using them both • “Trade-off” characterization • it is impossible to promote both internal and external validity within a single study • the researcher must choose which will be emphasized in a particular study • internal validity (control) • external validity (representativeness) • “Precursor” characterization • without causal interpretability (from having internal validity), what is there to generalize ??? • focuses on causal information - suggesting associative information is not valuable
Practice with Types of Variables & Types of Equivalence I’m concerned that before the treatment began, those in the Drug Treatment group were more depressed than were those in the Therapy Treatment group. Are you sure that there was no problem allowing those in the Drug Treatment group to attend an extra 5 sessions ? Those in the Therapy Treatment group didn’t have the extra sessions. • Depression: • Subject/Measured Variable • Initial Equivalence Tell the confounding variable, whether it is sub/msr or manip/proc and tell the type equivalence that is at “risk” ... • # sessions: • Manip./Procedural Variable • Ongoing Equivalence
More practice ... Tell the confounding variable, whether it is sub/msr or manip/proc and tell the type equivalence that is at “risk” ... To save time, only those who are familiar with computers were included in the Computer Training Condition, and everybody else was put in the Lecture Condition. Because of the class schedule, those in the Computer Training Condition only had 20 minutes to take the test, while those in the Lecture Condition had 30 minutes. • Familiarity: • Subject Variable • Initial Equivalence • Training time: • Procedural Variable • Ongoing Equivalence
From before -- using our new language RH: Computerized spelling practice leads to better performance than does paper & pencil practice. Twenty English speaking 4th grade students were given 10 words and practiced them 5 times each on the computer. Twenty English speaking 2nd grade students were given the same 10 words and practiced them 3 times each using paper & pencil. When tested the “computer practice” students did better than the “paper & pencil practice” students We identified “grade” as a confound. Does it mess up initial or ongoing equivalence & how do you know ?? initial equivalence -- it is a subject/measured variable We identified “number of practices” as a confound. Does it mess up initial or ongoing equivalence & how do you know ?? ongoing equivalence -- it is a manipulated/procedural variable
Another from before -- using our new language RH: Group therapy will lead to lower dep. scores than individual therapy Ten female patients with no prior therapy completed a 24-session course of group therapy, meeting each time at the university psychiatric clinic. Ten other female patients, each of whom had previously received therapy for depression, completed a 10-session series of individual therapy, meeting at the same clinic. After the respective therapies, the group therapy patients had lower depression scores. We identified “# sessions” as a confound. Does it mess up initial or ongoing equivalence & how do you know ?? ongoing equivalence -- it is a manipulated/procedural variable We identified “prior therapy” as a confound. Does it mess up initial or ongoing equivalence & how do you know ?? initial equivalence -- it is a subject/measured variable
Just one more -- this one has changed -- find all the confounds and tell what part of internal validity each “screws up” RH: More therapy sessions will lead to lower dep. scores. Ten male patients with no prior therapy completed a 24-session course of group therapy, meeting each time at the university psychiatric clinic. Ten other female patients, each of whom had previously received therapy for depression, completed a 10-session series of individual therapy, meeting at a local church. After the respective therapies, the group therapy patients had lower depression scores. • Gender -- msr/sub variable • Prior Therapy -- msr/sub var Initial equivalence confounds? • # sessions -- manip/proc var • meeting location -- manip/proc var Ongoing equivalence confounds?
How do we “produce” internal validity???? Important point -- we use different techniques to produce initial equivalence (of subject variables) and to produce ongoing equivalence (of procedural variables). Initial equivalence of subject variables Random assignment of individual participants to treatment conditions before treatment begins Ongoing equivalence of procedural variables Random Assignment of procedural alternatives Procedural standardization of manipulation, confound control, task completion and performance measurement Darn it!!! There is no one “cure” for procedural confounds, they are avoided only by knowledge of their existence and diligent adherence to experimental procedures!
When are external and internal validity important??? External validity is obviously ALWAYS important! For any study we need to know to who, what, where & when it directly applies and “how far” it can be generalized! You can find the argument that “internal validity is only important if you are testing causal RH:”… but consider this… The more confounds you have, the less you learn from their being a statistical association between two variables, whether what you are trying to learn is associative or causal !!!
From which study will you learn more??? Study #1 Those who got more practices were also more motivated and were run during a different semester than those who got fewer practices Study #2 Those who got more practices were equally motivated and were run during the same semester than those who got fewer practices Whether you are testing a causal or an associative RH, the data from Study #2 is going to be easier to interpret! The fewer confounds you have, the more you learn from their being a statistical association between two variables, whether what you are trying to learn is associative or causal !!!
ParticipantAssignment – “creating” initial equivalence • “Who will be in what condition of the study when?” • goal is to for participants in each condition of the study to be equivalent, on the average, before the manipulation begins • related type of validity is Internal validity - initial equivalence • Note: participant assignment has nothing to do with the External Validity of the study -- only the internal validity component of internal validity (causal interpretability) • How this works for each type of design … • In Between Groups Designs • each participant will complete only one condition -- randomly determine which condition for each participant • In Within-Groups Designs • each participant will complete all conditions -- randomly determine the condition order for each participant
AcceptableParticipant Assign. Procedure for Causal RH: • Random Assignment of individuals by the researcher • each participant has an equal chance of being in each condition of the study (BG) or each condition order (WG) • thus, all subject variables are “balanced” or “averaged out” across the conditions before manipulation begins • this what gives us “initial equivalence” in a true experiment • Random assignment for Between Groups Designs • Each participant will complete one condition (Tx1 or Tx2) • 1st participant -- flip a coin assign Tx1 if heads or Tx2 if tails • 2nd participant -- gets opposite of 1st participant • 3rd participant -- flip coin again & assign Tx1 or Tx2 • 4th gets opposite condition of 3rd participant • Remember … • random assignment doesn’t guarantee initial equivalence (though we act like it does) • random assignment is more likely to produce initial equivalence the larger the sample -- “better chance for chance to work”
Random assignment for Within-Groups Designs • Each participant will complete both conditions (Tx1 & Tx2) • For WG designs, RA is called “counterbalancing” • 1st participant -- flip a coin assign the order Tx1-Tx2 if heads or the order Tx2-Tx2 if tails • 2nd participant -- gets opposite order of 1st participant • 3rd participant -- flip coin again & assign the condition order • 4th gets opposite order of 3rd participant • Remember … • random assignment doesn’t guarantee initial eq. • random assignment “works better” the larger the sample • Two important things about RA for WG designs… • Not all studies can be run with a WG design • e.g. can’t run gender as a WG design (or other subject variables) • Can’t counterbalance all sets of conditions • e.g., can’t counterbalance “0 vs. 10 practices” or “before-after”
Separating “Selection” & “Assignment” Pop A common representation of the participant acquisition process is shown below. Folks are randomly chosen from the pop and placed into one of 2 groups. Participant Selection Ext Val Population Pool Participant Assignment Int Val Initial Equivalence T C Pop What usually happens is shown above: First participants are selected into a “pool” and then are assigned into groups. Different aspects of validity are influenced by each step!!! T C
Unacceptable-- procedures that thwart testing Casual RH: • Random assignment of groups (rather than individuals) • don’t know that the groups were equivalent • Arbitrary Assignment by the researcher • anything not using a “probabilistic” process -- might even be based on a “good idea” -- but isn’t random • Self Assignment by the participant • participant chooses what condition/order they will be in • Administrative Assignment • non-random assignment determined by someone other than the researcher • Non-Assignment or “Natural Assignment” • participant is already “in” conditions before they arrive at the study -- “causal variable” is really a subject variable Problem with all of these? For each of these there is a “reason” for why participants are in a particular condition/order -- that reason, and anything associated with it produces a confounding of initial equivalence
Tell whether each is random, arbitrary, self, administrative or involves no assignment (were in “natural groups” before arriving to participate in the study... • after being presented with the options, each patient chose whether they would receive the “standard” or the “experimental” operation • the researcher decided that the first 20 participants would be assigned to the treatment condition, the rest would be assigned to the control • the Hospital Executive Committee determined that people who were over 60 years old would all receive the “standard” operation and all others would be randomly assigned to which operation they would receive • medical records were examined to determine if the each participant had received the “standard” or “experimental” operation • whether each patient would receive the “standard” or “experimental” operation was determined by a coin-flip • the researcher flipped a coin to decide which dormitory would receive in-room internet access and which would continue with common-room access Self Arbitrary Admin None RA RA- groups
Random Assignment to ControlInitialvs. Ongoing Equivalence • Randomly assigning individual participants to the conditions of a study (which condition for BG or condition order for WG) is used to control initial equivalence of subject variables. • RA “ensures” that, on average, participants in the different conditions (BG) or different condition orders (WG) are the same “on average” on all subject variables • We also use random assignment to help control the ongoing equivalence of some procedural variables, for example… • if we have multiple research assistants – we should RA which research assistant runs each participant • researcher gender, age, appearance, race/ethnic & perceived comfort are all known to influence participant motivation, attention & performance !!! • if we have multiple sets of instrumentation – we should RA which set is used for each participant
Separating Assignment for Initial & Ongoing Equivalence So, the whole process often looks like this… Multiple Procedural Assignment steps may be necessary: Data collector, room, equipment, stimulus set, data coder, etc. Pop Participant Selection Ext Val Population Pool Participant Assignment Int Val Initial Equivalence T C Procedural Assignment Int Val Ongoing Equivalence Jane Sam Jane Sam
Tell whether each random assignment controls subject variables or procedural variables and whether the RA improves initial eq. or ongoing eq. … • IV is type of operation • whether each patient would receive the “standard” or “experimental” operation was determined by a coin-flip • we flipped another coin to decide which of four surgeons would perform the operation • IV is vision vs. touch • ½ the participants were assigned to use the old stimulus set we’ve been using for years and ½ were assigned to use the new stimulus set we just had made this semester • ½ the participants were randomly assigned to the visual condition, while the other ½ completed the touch condition • IV is treatment vs. control • Jane ran a random ½ of the participants and Sam ran the other ½ • whether the participant was run in the treatment or control condition was based the roll of a 6-sided die. SV initial PV ongoing PV ongoing SV initial PV ongoing SV initial
Procedural Standardization – “maintaining” ongoing equivalence • After participants are assigned, they must … • complete the research task • interact with the research stimuli • have the response variable measured • We must be certain that … • we do not influence the behavior and responses of the participants • we do not provide information that would allow the participants to guess the research hypotheses or expected outcome of the research Please note: This material interrelates with issues of data collection we will discuss later. But, because it is part of our internal validity concerns I wanted to introduce it here.
Reactivity& Response Bias • Both of these refer to getting “less then accurate” data from the participants Reactivity is the term commonly used when talking about observational data collection • the participant may behave “not naturally” if they know they are being observed or are part of a study • Naturalistic & disguised participant observation methods are intended to avoid this • Habituation and desensitization help when using undisguised participant observation • Response Bias is the term commonly used when talking about self-report data collection • Social Desirability is when participants describe their character, opinions or behavior as they think they “should” or to present a certain impression of themselves • Protecting participants anonymity and participant-researcher rapport are intended to increase the honest of participant responses
Observer Bias& Interviewer Bias Both of these are versions of “seeing what you want to see” Observer Bias is the term commonly used when talking about observational data collection • Both observational data collection and data coding need to be done objectively and accurately • Automation & instrumentation help – so does using multiple observers/coders and looking for consistency Interviewer Bias is the term commonly used when talking about self-report data collection • How questions are asked by interviewers or the interviewers reaction to answers can drive response bias • More of an challenge with fact-to-face interviews • Computerized and paper-based procedures help limit this Effects of participant-research gender, race, age, personality, etc. match/mismatch have been shown to influence the behavior of both !!!
Experimenter Expectancy Effects A kind of “self-fulfilling prophesy” during which researchers unintentionally “produce the results they want”. Two kinds… Modifying Participants Behavior • Subtle differences in treatment of participants in different conditions can change their behavior… • Inadvertently conveying response expectancies/research hypotheses • Difference in performance due to differential quality of instruction or friendliness of the interaction Data Collection Bias (much like observer bias) • Many types of observational and self-report data need to be “coded” or “interpreted” before they can be analyzed • Subjectivity and error can creep into these interpretations – usually leading to data are biased toward expectations
Single& Double-blind Procedures One way to limit or minimize the various biasing effects we’ve discussed is to limit the information everybody involved has InSingle Blind Proceduresthe participant doesn’t know the hypotheses, the other conditions in the study, and ideally, the particular condition they are in (i.e., we don’t tell how the task or manipulation is designed to change their behavior) In Double-blind Proceduresneither the participant nor the data collector/data coder knows the hypotheses or other information that could bias their responses (participant) or their reporting/coding (researchers) Sometimes this simply can’t be done because of the nature of the variables or the hypotheses involved.