Download
1 / 29
290 likes | 294 Vues
Methodology used in the CIDA study – an example of India. AIACC Asia-Pacific Region Open Meeting March 2003 – Tutorial session. An ongoing study……. Vulnerability of Indian agriculture to climate change and globalisation Supported by CIDA and the Government of Norway

E N D
Methodology used in the CIDA study – an example of India AIACC Asia-Pacific Region Open Meeting March 2003 – Tutorial session
An ongoing study…… Vulnerability of Indian agriculture to climate change and globalisation • Supported by CIDA and the Government of Norway • TERI, CICERO and IISD as partners
Main objectives • Identify highly vulnerable regions and social groups • Study factors that enhance or constrain coping capacity
Methodology • Vulnerability profile • Case studies • Integration of macro- and micro- scale analyses • Policy survey and recommendations
Methodology • Vulnerability profile • Case studies • Integration of macro- and micro- scale analyses • Policy survey and recommendations
Scale at which the study was planned • Using GIS techniques, district level analysis was undertaken for India • Information collected for more than 450 districts of India
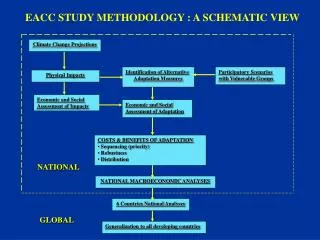
Procedure followed for developing a vulnerability profile Physical Three aspects Economic Social Regions of high vulnerability
Indicators identified and selected • Physical vulnerability • Soil degradation and cover, groundwater extraction • (Flood and drought prone areas)
Indicators identified and selected • Social vulnerability • Literacy levels, % cultivators to labourers, Infrastructure development, gender discrimination, irrigation availability • (% population below the poverty line, mechanisation of agriculture)
Construction of base vulnerability map • Data on each of the indicators collected • Individual thematic layers of each indicator prepared • Weightages assigned • Generation of physical and social vulnerability maps • Overlay of both physical and social vulnerability maps to develop the base vulnerability map
Indicators identified and selected • Climatic factors • (intra-annual precipitation variability, inter-annual precipitation variability and dryness index) • (frequency and intensity of cyclones)
Construction of climate sensitivity index • Data on each of the indicators collected – both observed and scenario data used • Individual thematic layers of each indicator prepared • Weightages assigned • Generation of CSI
Construction of climate change vulnerability map • Based on an overlay of the climate change vulnerability map and the base vulnerability map, regions that are sensitive to both current climate variability and future climate change as well as other biophysical and social factors are identified
Indicators identified and selected • Economic vulnerability • Port distance, cropping patterns • Food crops (rice, wheat, maize, gram) • Commercial crops (sugarcane, tobacco, cotton) • Export/ import crops (groundnut, rapeseed and mustard) • Other crops (Onion) • (Other crops: spices, tea, coffee, horticultural crops – apples etc)
Construction of trade sensitivity index • Data on each of the indicators collected Individual thematic layers of each indicator prepared • Weightages assigned • Generation of TSI
Construction of globalisation vulnerability map • Based on an overlay of the globalisation vulnerability map and the base vulnerability map, regions that are sensitive to both trade as well as other biophysical and social factors are identified
Climate change vulnerability Globalization vulnerability Elements of vulnerability profiles • Biophysical vulnerability • Soil degradation and cover • Flood prone districts • Groundwater extraction Climate sensitivity index(precipitation variability and dryness) Base vulnerability index Trade sensitivity index(port distance and export- & import- crops) • Socioeconomic vulnerability • Agricultural workers and labourers • Irrigation availability • Literacy • Infrastructure • Gender discrimination
Methodology • Vulnerability profile • Case studies • Integration of macro- and micro- scale analyses • Policy survey and recommendations
Data not available High vulnerability Village-level case studies Jhalawar district, Rajasthan Chitradurga district, Karnataka Low vulnerability
Objective To assess how factors within the context of key domestic policies either enhance or constrain the ability of farmers’ to cope with climate change
Participatory rural appraisals Focused group discussions with small and marginal farmers One-to-one meetings with village heads and district administrative officers Questionnaire-based survey Economic status Agricultural practices Coping mechanisms Access to facilities (electricity, irrigation, health, education, loans, etc) Case study approach
Next steps • Integrate case study results (3 more planned) and policy analysis with macro-level vulnerability profile - develop matrix relating globalization, policies, and climate vulnerability for agriculture sector • Recommendations for adaptation