Download
1 / 21
260 likes | 567 Vues
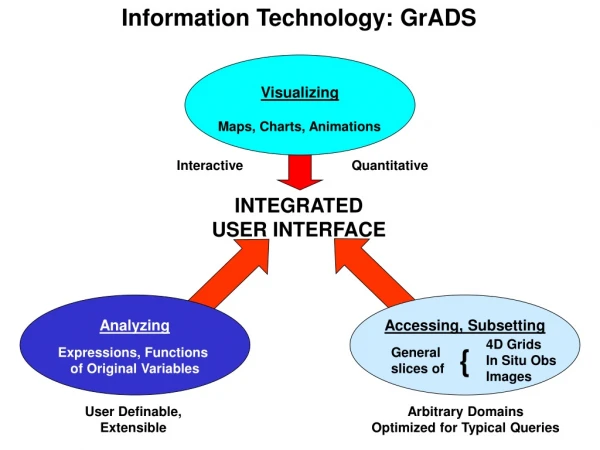
GrADS for Beginners. Dr. ismail DEMiR. What is GrADS and how do I get it? GrADS essentials Getting started Gridded data sets Displaying data Saving your plots. Outline. Gr id A nalysis and D isplay S ystem Developed at the Center for Ocean-Land-Atmosphere Studies (COLA)

E N D
GrADS for Beginners Dr. ismail DEMiR 18-23 August 2011Training WorkshopClimate Predictions for TSMSAnkara, Turkey
What is GrADS and how do I get it? GrADS essentials Getting started Gridded data sets Displaying data Saving your plots Outline 18-23 August 2011Training WorkshopClimate Predictions for TSMSAnkara, Turkey
Grid Analysis and Display System Developed at the Center for Ocean-Land-Atmosphere Studies (COLA) Used for displaying and manipulating earth science data Binary, GRIB, NetCDF, HDF-SDS Station data (contours / grid boxes) and gridded data Line and bar graphs, scatter plots, streamlines, wind vectors What is GrADS? 18-23 August 2011Training WorkshopClimate Predictions for TSMSAnkara, Turkey
GrADS home page with FREE downloads: http://www.iges.org/grads/ Latest version (GrADS 2.0.a9) runs on Linux Mac OS X Older versions available for SUN, SGI/IRIX, DEC, IBM/AIX Installation details are very easy for all system with detailed user guide How do I Get GrADS? 18-23 August 2011Training WorkshopClimate Predictions for TSMSAnkara, Turkey
Type grads (there are a bunch of arguments you can use, but we won’t get into them here) You will be prompted for landscape mode; ‘no’ will get portrait mode (shown) Your work areas will consist of a display screen and the window where you executed GrADs, which is where you type your commands (note: all examples are from the Linux version; I can’t vouch for the others) To exit, type quit GrADS Essentials: Getting Started 18-23 August 2011Training WorkshopClimate Predictions for TSMSAnkara, Turkey
GrADS descriptor files (*.ctl) contain the basic information on a data file: dset ^model.grb title "Sample Model Data for lats4d Tutorial" undef 1e+20 dtype grib index ^model.gmp xdef 72 linear 0.000000 5.000000 ydef 46 linear -90.000000 4.000000 zdef 7 levels 1000 850 700 500 300 200 100 tdef 5 linear 0Z1jan1987 1dy vars 8 ps 0 1, 1, 0, 0 Surface pressure [hPa] ua 7 33,100 Eastward wind [m/s] va 7 34,100 Northward wind [m/s] zg 7 7,100 Geopotential height [m] ta 7 11,100 Air Temperature [K] hus 7 51,100 Specific humidity [kg/kg] ts 0 11,105, 2 Surface (2m) air temperature [K] pr 0 59, 1, 0, 0 Total precipitation rate [kg/(m^2*s)] endvars Gridded Data Sets: File Specs File name (^ means current directory) Description “Undefined” (i.e., ignored) value Data type grib and grib2 formats require an index file with additional information (can greate using gribmap or grib2map in GrADS) 18-23 August 2011Training WorkshopClimate Predictions for TSMSAnkara, Turkey
GrADS descriptor files (*.ctl) contain the basic information on a data file: dset ^model.grb title "Sample Model Data for lats4d Tutorial" undef 1e+20 dtype grib index ^model.gmp xdef 72 linear 0.000000 5.000000 ydef 46 linear -90.000000 4.000000 zdef 7 levels 1000 850 700 500 300 200 100 tdef 5 linear 0Z1jan1987 1dy vars 8 ps 0 1, 1, 0, 0 Surface pressure [hPa] ua 7 33,100 Eastward wind [m/s] va 7 34,100 Northward wind [m/s] zg 7 7,100 Geopotential height [m] ta 7 11,100 Air Temperature [K] hus 7 51,100 Specific humidity [kg/kg] ts 0 11,105, 2 Surface (2m) air temperature [K] pr 0 59, 1, 0, 0 Total precipitation rate [kg/(m^2*s)] endvars Gridded Data Sets: Grid Specs Zonal and meridional grid specs: number of grid boxes, increment type, minimum, resolution Vertical grid: number of levels, increment type, pressure levels Time grid: number of time periods, increment type, minimum, resolution 18-23 August 2011Training WorkshopClimate Predictions for TSMSAnkara, Turkey
GrADS descriptor files (*.ctl) contain the basic information on a data file: dset ^model.grb title "Sample Model Data for lats4d Tutorial" undef 1e+20 dtype grib index ^model.gmp xdef 72 linear 0.000000 5.000000 ydef 46 linear -90.000000 4.000000 zdef 7 levels 1000 850 700 500 300 200 100 tdef 5 linear 0Z1jan1987 1dy vars 8 ps 0 1, 1, 0, 0 Surface pressure [hPa] ua 7 33,100 Eastward wind [m/s] va 7 34,100 Northward wind [m/s] zg 7 7,100 Geopotential height [m] ta 7 11,100 Air Temperature [K] hus 7 51,100 Specific humidity [kg/kg] ts 0 11,105, 2 Surface (2m) air temperature [K] pr 0 59, 1, 0, 0 Total precipitation rate [kg/(m^2*s)] endvars Gridded Data Sets: Data Specs Number of variables in file List of variables: name used by GrADS, number of vertical levels, units (used only for grib; use 99 otherwise), description 18-23 August 2011Training WorkshopClimate Predictions for TSMSAnkara, Turkey End of variable listing
Displaying Data: Default Display • From the control file on the previous slides, a default display can be created using simply : > open model.ctl > d ps Plot the pressure (‘ps’) field Open the GrADS control file 18-23 August 2011Training WorkshopClimate Predictions for TSMSAnkara, Turkey
Displaying Data: Cross Section Subset lon.=180 W to 0 W, lat.=40 N, 500 hPa, time=1 • We can also modify the area of interest: > clear > set lon -180 0 > set lat 40 > set lev 500 > set t 1 > d zg Clear the display Plot the height (‘z’) field 18-23 August 2011Training WorkshopClimate Predictions for TSMSAnkara, Turkey
Displaying Data: Multivariate Cross Section • We can also display multiple variables on a field: > clear > set lon -90 > set lat -90 90 > set lev 1000 100 > set t 1 > d ta > d ua Subset lon.=90 W, lat.=90 S to 90 N, height=1000-100 hPa, time=1 Plot the temperature (‘t’) field followed by the height (‘u’) field 18-23 August 2011Training WorkshopClimate Predictions for TSMSAnkara, Turkey
GrADS can produce numerous types of file displays using gridded data using set gxout: Displaying Data: Graphics Types 18-23 August 2011Training WorkshopClimate Predictions for TSMSAnkara, Turkey
Example of plotting wind vectors: > clear > set gxout vector > d ua;va Displaying Data: Wind Vectors Graphics output type=vector Plot both zonal (‘u’) and meridional (‘v’) components of wind 18-23 August 2011Training WorkshopClimate Predictions for TSMSAnkara, Turkey
Example of plotting actual grid point values: • > clear > set gxout grid > d ua Graphics output type=grid Displaying Data: Grid Values 18-23 August 2011Training WorkshopClimate Predictions for TSMSAnkara, Turkey
We can also display the data in other projections using the set mproj command: Default is latlon set mproj off turns off the map projection Displaying Data: Other Projections 18-23 August 2011Training WorkshopClimate Predictions for TSMSAnkara, Turkey
Displaying Data: Other Projections Reference values (Polar Stereographic only): plots 120 to 75 W and 25 to 65 N • Example of plotting in polar stereo: > clear > Set lon -140 -40 > Set lat 15 80 > set mpvals -120 -75 25 65 > set mproj nps > set gxout contour > set cint 30 > d zg Contour interval=30 18-23 August 2011Training WorkshopClimate Predictions for TSMSAnkara, Turkey
GrADS supports several commands (run outside GrADS) to convert the .gmf file to other formats: gxps –i fname.gmf –o fname.ps(PostScript) gxeps–i fname.gmf –o fname.eps (Encapsulated PostScript) gxpng–i fname.gmf –o fname.png (.png format, but can also create a .gif using the –gif option) Saving Your Plots 18-23 August 2011Training WorkshopClimate Predictions for TSMSAnkara, Turkey
The GrADS Documentation Page is a great resource: http://www.iges.org/grads/gadoc/ Especially useful are the quick references cards for GrADS commands and the scripting language at the bottom of the page! You can also subscribe to the GrADS Users Group (more info at http://www.iges.org/grads/users.html) GrADS-Related Resources 18-23 August 2011Training WorkshopClimate Predictions for TSMSAnkara, Turkey
aave = This function takes an areal average over an X-Y region d aave(ts,lon=0,lon=90,lat=20,lat=50) ave = average of specified dimension range d ave(zg,t=1,t=10) set clevs c1 c2 c3 c4 …. set cint 10 set lat …. ….. or set lat …. set lon …. ….. or set lon …. set lev …. ….. or set lev …. define var = expression define ts1=ave(ts,t=1,t,5) d ts1 18-23 August 2011Training WorkshopClimate Predictions for TSMSAnkara, Turkey
set mpdset <lowres|mres|hires|nmap> printimfilename options The printim command will produce a PNG, GIF, or JPG formatted image file based on the current contents of the metabuffer, which is usually the stuff displayed on the screen, minus any widgets. reset<qualifiers> This command returns GrADS to its initial state reinit This command returns GrADS to its initial state. It closes all open files, releases all defined variables, and resets all graphics settings to their defaults. 18-23 August 2011Training WorkshopClimate Predictions for TSMSAnkara, Turkey
Thank you 18-23 August 2011Training WorkshopClimate Predictions for TSMSAnkara, Turkey