Download
1 / 57
570 likes | 708 Vues
XIS Calibration on the Ground Status Report. K. Hayashida (Osaka University) and the XIS-team. XIS Components. XIS-Sensors CCID41-FI CCD EU (Engineering Unit) FM FI0 , FI1 , FI2,FI3 CCID41-BI CCD FM BI0 , BI1 AE/TCE FM AE/TCE01,23 EM AE/TCE DE FM 4PPU+MPU. FM Spare before Launch.

E N D
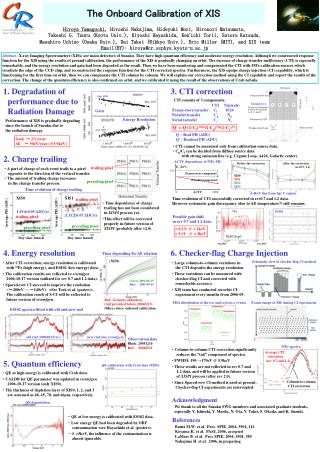
XIS Calibration on the GroundStatus Report K. Hayashida (Osaka University) and the XIS-team
XIS Components • XIS-Sensors • CCID41-FI CCD • EU (Engineering Unit) • FM FI0,FI1,FI2,FI3 • CCID41-BI CCD • FM BI0,BI1 • AE/TCE • FM AE/TCE01,23 • EM AE/TCE • DE • FM 4PPU+MPU FM Spare before Launch
XIS Data Reduction XIS Response depends on the reduction procedure • Frame Data /8sec • Dark-level Subtraction • Event Pickup (PH(E)>Event Threshold) • 5x5 mode, 3x3 mode or 2x2 mode • Event data • Charge Trail Correction • Grading / PHA-reproduction for PH(i)>Split Threshold • PHA-dependent Split Threshold for BI • Bad Columns Filter • Spectrum / Image / Light Curve Onboard DE On the ground
Event threshold 以上で最大の ピクセルレベルのピクセル grade0 grade4 Split threshold 以上でイベント に含むピクセル grade1 grade5 Split threshold 以上でイベント に含まないピクセル grade2 grade6 grade3 grade7 ※ 大きくイベントが広がる grade7 は、 エネルギー分解能を悪くするため データ処理には用いず、 grade02346 のみを使用する。 Event Grades • Grades 02346 are used as X-ray events.
PH [ADU] PH [ADU] PH [ADU] PH [ADU] BI1Mn K incidencePH(2)= preceding pixel ,PH(7)=trailing pixel Near readout node Far from readout node
-6 CTI = (4.5±0.3)×10 [ /Transfer ] Amount of Charge in the Trail Mn K BI1 CTI estimated from this trail PH(7)Center [ADU] *) temperature dependence was observed Number of V-Transfer in the Imaging Area
-4 -4 -0.5 -0.5 VCTI= (1.72・10 )×E HCTI= (6.06・10 )×E Incident X-ray Energy Dependence We can tell the amount of charge deposited in PH(7) and PH(5) => Charge Trail Correction
PH [ADU] PH [ADU] PH [ADU] PH [ADU] PH [ADU] PH [ADU] PH [ADU] PH [ADU] 電荷漏れ補正後のPH(2)、PH(7)の波高分布 (Mn K)
Effects of Charge Trail Correction • Correct Grade Branching Ratio and PH() • Reduce Grade7 events due to Charge Trail. 10%-20% increase in Grade02346 ratio at high energies. • Restore Non-uniformity in effective QE. • (Partial) Restoration in the Energy Scale. • Traps with Other time scales are not negligible.
電荷漏れ補正後のグレード分岐比 (FI2)電荷漏れ補正後のグレード分岐比 (FI2) バッドコラム除去
電荷漏れ補正後のグレード分岐比 (FI2)電荷漏れ補正後のグレード分岐比 (FI2)
電荷漏れ補正後のグレード分岐比 (BI1)電荷漏れ補正後のグレード分岐比 (BI1) バッドコラム除去
電荷漏れ補正後のグレード分岐比 (BI1)電荷漏れ補正後のグレード分岐比 (BI1)
G02346 event number FWHM (eV) Optimization of Split Threshold for BI1 Spth (ADU)
X-ray image (number of events /pixel) Bad (CTE) Columns • Bad CTE • Typically long trail in each event. • Sometimes flickering pixel is observed. • Rows near the readout node can be used. • Identification logic without accumulating 10^7events was developed. • EU= 21 bad columns/chip • FI0=14, FI1=12, FI2=17,FI3=24 • BI0=23, BI1=50 • How should we do for adjacent columns ?
バッドコラム その1 • (1) BAD CTE / Trail ColumnPH22 PH7 PH0 PH2 PH11 ACTX ACTY V 25 55 381 271 1 / 668 325V 27 61 1029 4 -1 / 668 336V 30 64 1490 -2 -1 / 668 239V 24 54 1471 1 1 / 668 729V 22 62 1043 164 -2 / 668 239V 22 44 1672 1 1 / 668 221V 32 145 1316 3 0 / 668 570<PH[7]-PH[2]>で判別可能(e.g. >8AU)
バッドコラム その2 (2)BAD CTE ColumnsPH22 PH7 PH0 PH2 PH11 ACTX ACTY V 189 393 551 486 6 / 238 897V 4 6 1565 7 0 / 238 97V 179 353 549 346 3 / 238 798V 0 5 1548 3 2 / 238 171V 109 293 498 335 4 / 238 610V 204 394 565 459 8 / 238 919PH[7]>SplitTH(e.g.20) && PH[2]>SplitTH(e.g.20)のイベントの割合(e.g. >0.2)で判別可能
バッドコラムその3 (3) Flickerging PixelsPH22 PH7 PH0 PH2 PH11 ACTX ACTY V 26 74 81 42 17 / 51 879V 1 5 58 1 -3 / 51 262V -1 -2 54 2 3 / 51 262V -1 3 75 1 1 / 51 262V 0 671 945 2 0 / 51 272V 1 2 1779 1 2 / 51 717ピクセル毎のイベントの頻度で判別可能(e.g.>0.1c/frame)
Kyoto Cal System • Fluorescent X-rays (Al,Cl,Ti,Mn,Fe,Zn,Se) • Windowless Si-SSD is used as the reference counter, assuming 100% efficiency >1.5keV • XIS FI-CCD QE=96%@4.5keV is assumed
Calibration Facility in the Osaka Clean Room Detector Chamber Manson Soft X-ray Generator Hetrick Spectrometer
Dispersion (Grating) Spectrum projection • X-ray image X-ray energy FWHM~5eV O-Kα(0.53keV) C-Kα(0.28keV) Dispersion direction Number of events/columns
Astro-E1 (FI) XIS Astro-E2 (FI) XIS Line profile against O-K line incidence 5 kV FI2 PHA(ADU) XIS1 (H.Katayama master thesis)
Line Profile model (1) Main Peak:Absorption in Depletion Layer (2)Sub Peak:Lost charge below Split-threshold (3) Triangle Comp.:Channel Stop origin (4) Constant Comp.:Partial absorption in SiO2 F3 parameters: T1 (normalization),C1(center), S1(sigma) T2 (relative to T1),C2(spth/2, fixed), S2 (1.78×S1, fixed) T3 (relative to T1), F3(三角形の幅, 0.5×C1) T4 (T1で規格化した面積) → フリーパラメタ 6個 でフィット BI structure
Line profile for FI1 sensor Se-L line E=1.379keV O-K line E=0.525keV T2=0.033, T4=0.0052 T2=0.020, T4=0.0045 (Seg.B)
Line profile for BI1 sensor C-K line E=0.277keV Al-K line E=1.487keV O-K line E=0.525keV T2=0.19, T4=0.015 T2=0.071, T4=0.011 T2=0.078, T4=0.016
FI2 g02346 スペクトルの比較
FI2 g02346 スペクトルの比較
BI1 g02346 スペクトルの比較
BI1 g02346 スペクトルの比較
Energy and Pulse-height Linearity BI1, Seg.C FI1, Seg.C
Energy Resolution (FWHM) FI-1, Seg.C BI-1, Seg.C
Quantumn Efficiency Measurement • Relative Efficiencies of FM-FI0,FI1,FI2,FI3,BI0,BI1 and XIS-EU are measured by irradiating X-rays from the spectrometer to whole the CCD area. • Generator beam current is always monitored and stabilized <1%. • XIS-EU was cross-calibrated to a Gas PC on 2003Dec & 2004Jul. XIS-FM are not installed in the chamber with the Gas PC simultaneously. • The gas PC was calibrated through the slant incident method in 2004 January.
X-rays X-rays Slant Incident Method: Application to Gas PC We determined to use the Gas PC as the reference counter
Ratio of Counting rate of Gas PC 30°/0° 45°/0°
2004年1月実験の再解析 • 比例計数管の窓のメッシュ • 50mm厚、0.5mmピッチ • 開口率0.763 (X線で実測) • 断面○ではなく□を仮定 • 30°/0°と45°/0°を 同時フィット • X線発生装置の長期変 動を補正
X-rays through Slit ( ~1mm) Dispersion Direction
PC Spectra and CCD Spectra PC (0.525keV) XIS-EU (0.525keV)
Relative QE XIS-EU FI1 FI0 Red=line component FI2 FI3
Relative QE of BI0,BI1 to XIS-EU BI1 BI0 ~80@0.28 keV~10@0.6 keV
XAFS near the O-Kedge FI-2 Eedge = 0.532 ±0.001 keV red. c2 = 1.3178 (d.o.f. = 418)
Upper limit of Surface dead layer in BI-CCD Dispersion Spectrum with BI 0.45 0.5 0.55 0.6 keV μm (H2O) H2O on BI1 <0.11 μm