Download
1 / 13
150 likes | 274 Vues
Euromech 10 th European Turbulence Conference 29 June – 2 July 2004, Trondheim, Norway. An experimental study of bypass transition in plane Couette flow. S. AMALFI, F. LAADHARI & J. F. SCOTT Laboratoire de Mécanique des Fluides et d’Acoustique Unité Mixte de Recherche 5509

E N D
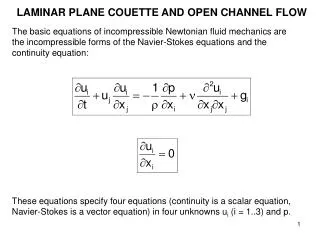
Euromech10 th European Turbulence Conference29 June – 2 July 2004, Trondheim, Norway An experimental study of bypass transition in plane Couette flow S. AMALFI, F. LAADHARI & J. F. SCOTTLaboratoire de Mécanique des Fluides et d’Acoustique Unité Mixte de Recherche 5509 69 134 ECULLY, France
Introduction • 2 different kinds of transition to turbulence in 2D bounded flows: • Plane Couette flow (PCF) is of particular interest : • simplicity of the basic flow and the absence of linear instability. • Recent scenario* : • streamwise vortices streaks secondary instabilities turbulence • The aim of the present study : investigate such a scenario in PCF introducing Counter rotating pairs of streamwise vortices based on optimal criteria. *Reddy et al. (1998), J. Fluid Mech., 365, 269-299
Outline • Experimental setup and perturbation generating system • Tomography animation and flow characteristics based on LDA measurements • Visualization of vortical structures and statistical analysis based on PIV measurements • Conclusion and perspectives
PCF : flow between one or two moving belts • Very few experimental PCF studies, considering several setup difficulties (moving belts stability, free stream perturbations, etc.) • Reynolds number of interest is 470 with . Laminar Motor Encoder Top view Re ≤ 470 ZOOM Turbulent Water Ly=2h=2.6 cm Re ≥ 500 Lx=200 cm Lz=30 cm Experimental facilities Tomography and LDA results PIV analysis Experimental setup
Experimental facilities Tomography and LDA results PIV analysis
Experimental facilities Tomography and LDA results PIV analysis 30° 5 mm 50 mm 40 mm Perturbation system based on optimal perturbations* * Butler & Farrell (1992), Phys. Fluids, 4, 1637-1650
Experimental facilities Tomography and LDA results PIV analysis moving belt plexiglass wall
Experimental facilities Tomography and LDA results PIV analysis
cm/s Y (mm) Time (s) Before injection After injection -1 -0.5 Y (cm) 0 0.5 1 -4 -3 -2 -1 0 1 2 3 4 Averaged streamwise velocity (cm/s) Experimental facilities Tomography and LDA results PIV analysis Instantaneous streamwise velocity
Experimental facilities Tomography and LDA results PIV analysis Visualization of vortical structures • PIV measurements (2 000 snapshots)performed in the transverse plane. Snapshot size : 26 mm (y) x 96 mm (z) giving two velocity components : v and w (along y et z). • Dynamical analysis of structures possible, considering very low velocities of moving walls (3.6 cm/s) with a 4 Hz frequency acquisition • Normalized Angular Momentum*is a good tool to visualize vortical structures * Michard et al. (1997), 11th Int. Symp. Turbulent Shear Flows, F. Durst, Springer, 278-290
Z Z Z Z Z Z Z Z Z Z Time (s) Time (s) Time (s) Time (s) Time (s) Time (s) Times (s) Time (s) Time (s) Time (s) Z (mm) Z (mm) Z (mm) Z (mm) Z (mm) Z (mm) Z (mm) Z (mm) Z (mm) Z (mm) Time (s) Time (s) Time (s) Time (s) Time (s) Time (s) Time (s) Time (s) Time (s) Time (s) Y (mm) Y (mm) Y (mm) Y (mm) Y (mm) Y (mm) Y (mm) Y (mm) Y (mm) Y (mm) 300 ≤ Time (s) ≤ 350 400 ≤ Time (s) ≤ 450 350 ≤ Time (s) ≤ 400 200 ≤ Time (s) ≤ 250 050 ≤ Time (s) ≤ 100 250 ≤ Time (s) ≤ 300 150 ≤ Time (s) ≤ 200 450 ≤ Time (s) ≤ 500 100 ≤ Time (s) ≤ 150 Energy (m²/s²) Energy (m²/s²) Energy (m²/s²) Energy (m²/s²) Energy (m²/s²) Energy (m²/s²) Energy (m²/s²) Energy (m²/s²) Energy (m²/s²) Energy (m²/s²) Time (s) Time (s) Time (s) Time (s) Time (s) Time (s) Time (s) Time (s) Time (s) Time (s) Experimental facilities Tomography and LDA results PIV analysis Time 001 ≤ Time (s) ≤ 050
Energy (m²/s²) Time (s) d/h Time (s) Time (s) Experimental facilities Tomography and LDA results PIV analysis
Conclusion and Perspectives • First PIV database concerning PCF • Transient growth of secondary instabilities has been observed using visualizations and PIV measurements • Mean size of structures doesn’t play a key role in the transition process • but vortex intensity does ! • LDA measurements confirming PIV study • Comparison with other complex cases : Boundary Layer over a flat plate