Download
1 / 1
10 likes | 143 Vues
Desert dust effects on ozone photolysis during the MINNI-MORE campaign. Giandomenico Pace 1 , Wolfgang Junkermann 5 , Marco Cacciani 2 , Giampietro Casasanta 2 , Claudia di Biagio 1,4 , Nicoletta di Genova 2 , Alcide di Sarra 1 , David Mateos 3 ,

E N D
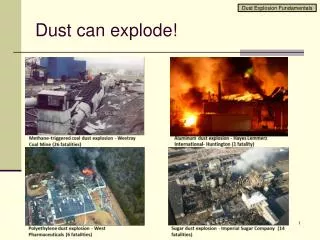
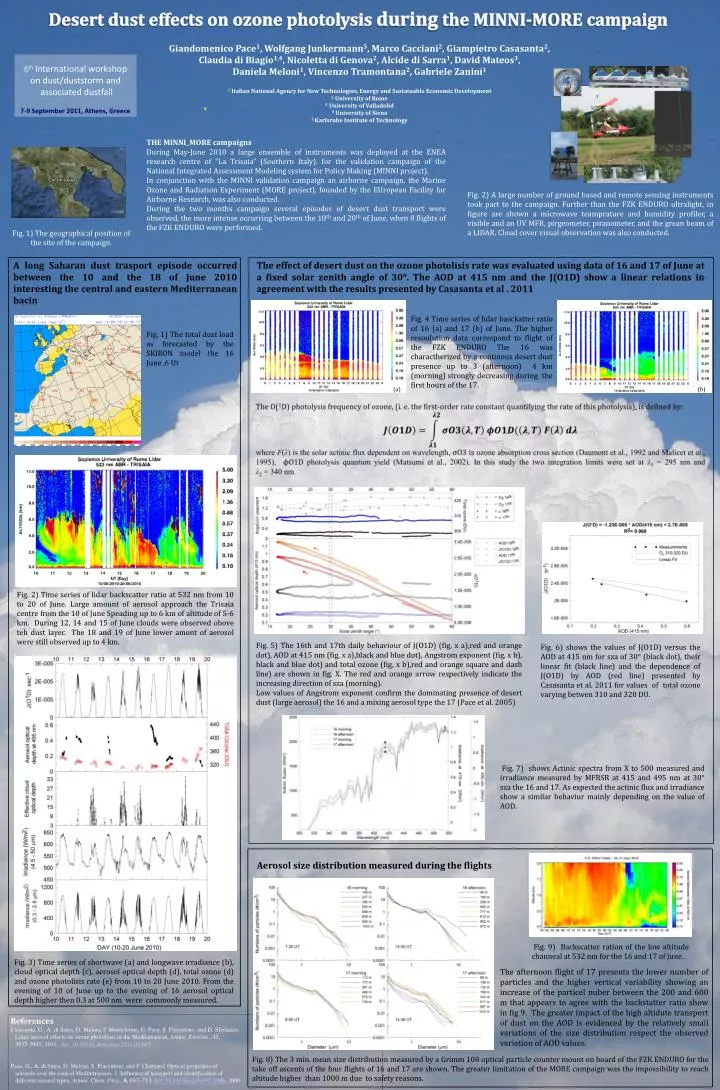
Desert dust effects on ozone photolysis during the MINNI-MORE campaign Giandomenico Pace1, Wolfgang Junkermann5, Marco Cacciani2, Giampietro Casasanta2, Claudia di Biagio1,4, Nicoletta di Genova2, Alcide di Sarra1, David Mateos3, Daniela Meloni1, Vincenzo Tramontana2, Gabriele Zanini1 1 Italian National Agency for New Technologies, Energy and Sustainable Economic Development 2 University of Rome 3 University of Valladolid 4 University of Siena 5 Karlsruhe Institute of Technology 6thInternational workshop on dust/duststorm and associated dustfall 7-9 September 2011, Athens, Greece THE MINNI_MORE campaigns During May-June 2010 a large ensemble of instruments was deployed at the ENEA research centre of “La Trisaia” (Southern Italy), for the validation campaign of the National Integrated Assessment Modeling system for Policy Making (MINNI project). In conjunction with the MINNI validation campaign an airborne campaign, the Marine Ozone and Radiation Experiment (MORE project), founded by the EUropean Facility for Airborne Research, was also conducted. During the two months campaign several episodes of desert dust transport were observed, the more intense occurring between the 10th and 20th of June, when 8 flights of the FZK ENDURO were performed. Fig. 2) A large number of ground based and remote sensing instruments took part to the campaign. Further than the FZK ENDURO ultralight, in figure are shown a microwave teamprature and humidity profiler, a visible and an UV MFR, pirgeometer, piranometer, and the grean beam of a LIDAR. Cloud cover visual observation was also conducted. Fig. 1) The geographical position of the site of the campaign. A long Saharan dust trasport episode occurred between the 10 and the 18 of June 2010 interesting the central and eastern Mediterranean bacin The effect of desert dust on the ozone photolisis rate was evaluated using data of 16 and 17 of June at a fixed solar zenith angle of 30°. The AOD at 415 nm and the J(O1D) show a linear relations in agreement with the results presented by Casasanta et al . 2011 Fig. 4 Time series of lidar basckatter ratio of 16 (a) and 17 (b) of June. The higher resoulution data correspond to flight of the FZK ENDURO The 16 was charactherized by a continous desert dust presence up to 3 (afternoon) 4 km (morning) strongly decreasing during the first hours of the 17. Fig. 1) The total dust load as forecasted by the SKIRON model the 16 June ,6 Ut (a) (b) Fig. 2) Time series of lidar backscatter ratio at 532 nm from 10 to 20 of June. Large amount of aerosol approach the Trisaia centre from the 10 of June Speading up to 6 km of altitude of 5-6 km. During 12, 14 and 15 of June clouds were observed obove teh dust layer. The 18 and 19 of June lower amont of aerosol were still observed up to 4 km. Fig. 5) The 16th and 17th daily behaviour of J(O1D) (fig, x a),red and orange dot), AOD at 415 nm (fig, x a),black and blue dot), Angstrom exponent (fig, x b), black and blue dot) and total ozone (fig, x b),red and orange square and dash line) are shown in fig. X. The red and orange arrow respectively indicate the increasing direction of sza (morning). Low values of Angstrom exponent confirm the dominating presence of desert dust (large aerosol) the 16 and a mixing aerosol type the 17 (Pace et al. 2005) Fig. 6) shows the values of J(O1D) versus the AOD at 415 nm for sza of 30° (black dot), their linear fit (black line) and the dependence of J(O1D) by AOD (red line) presented by Casasanta et al. 2011 for values of total ozone varying betwen 310 and 320 DU. Fig. 7) shows Actinic spectra from X to 500 measured and irradiance measured by MFRSR at 415 and 495 nm at 30° sza the 16 and 17. As expected the actinic flux and irradiance show a similar behaviur mainly depending on the value of AOD. Aerosol size distribution measured during the flights Fig. 9) Backscatter ration of the low altitude channeal at 532 nm for the 16 and 17 of June. Fig. 3) Time series of shortwave (a) and longwave irradiance (b), cloud optical depth (c), aerosol optical depth (d), total ozone (d) and ozone photolisis rate (e) from 10 to 20 June 2010. From the evening of 10 of June up to the evening of 16 aerosol optical depth higher then 0.3 at 500 nm were commonly measured. The afternoon flight of 17 presents the lower number of particles and the higher vertical variability showing an increase of the particel nuber between the 200 and 600 m that appears to agree with the backstatter ratio show in fig 9. The greater impact of the high altidute transport of dust on the AOD is evidenced by the relatively small variations of the size distribution respect the observed variation of AOD values. References Casasanta, G., A. di Sarra, D. Meloni, F Monteleone, G. Pace, S. Piacentino, and D. Sferlazzo, Large aerosol effects on ozone photolysis in the Mediterranean, Atmos. Environ., 45, 3937-3943, 2011, doi: 10.1016/j.atmosenv.2011.04.065 Pace, G., A. di Sarra, D. Meloni, S. Piacentino, and P. Chamard, Optical properties of aerosols over the central Mediterranean. 1. Influence of transport and identification of different aerosol types, Atmos. Chem. Phys., 6, 697–713, doi: 10.5194/acp-6-697-2006, 2006. D. Daumont, J. Brion, J. Charbonnier and J. Malicet, Ozone UV spectroscopy I: absorption cross-sections at room temperature, Journal of Atmospheric Chemistry15 (2) (1992), pp. 145–155. J. Malicet, D. Daumont, J. Charbonnier, C. Parisse, A. Chakir and J. Brion, Ozone UV spectroscopy. II. Absorption cross-sections and temperature dependence, Journal of Atmospheric Chemistry21 (3) (1995), pp. 263–273. Y. Matsumi, F.J. Comes, G. Hancock, A. Hofzumahaus, A.J. Hynes, M. Kawasaki and A.R. Ravishankara, Quantum yields for production of O(1D) in the ultraviolet photolysis of ozone: recommendation based on evaluation of laboratory data, Journal of Geophysical Research107 (D3) (2002), p. 4024 10.1029/2001JD000510. Fig. 8) The 3 min. mean size distribution measured by a Grimm 108 optical particle counter mount on board of the FZK ENDURO for the take off ascents of the four flights of 16 and 17 are shown. The greater limitation of the MORE campaign was the impossibility to reach altitude higher than 1000 m due to safety reasons.