Download
1 / 13
130 likes | 268 Vues
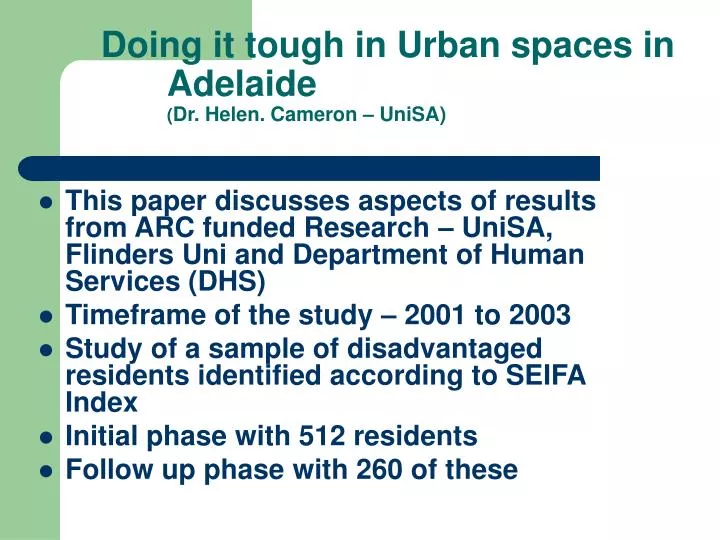
Doing it tough in Urban spaces in Adelaide ( Dr. Helen. Cameron – UniSA). This paper discusses aspects of results from ARC funded Research – UniSA, Flinders Uni and Department of Human Services (DHS) Timeframe of the study – 2001 to 2003

E N D
Doing it tough in Urban spaces in Adelaide(Dr. Helen. Cameron – UniSA) • This paper discusses aspects of results from ARC funded Research – UniSA, Flinders Uni and Department of Human Services (DHS) • Timeframe of the study – 2001 to 2003 • Study of a sample of disadvantaged residents identified according to SEIFA Index • Initial phase with 512 residents • Follow up phase with 260 of these
In this Session • Social Disadvantage of the Sample • Culture, Parenting & Housing • Perceptions of Trust & Safety • Backgrounds of Risk in the Suburbs • Collective Efficacy in the Neighbourhood • Synthesis of Issues • Conclusions
1. Social Disadvantage • 73.1% completed only Year 11 or less [Metro Adelaide: 52.3%] • 47.4% were of single-parents [Metro Adelaide 16.6%] and 46.6% were parents for the first time at < 19 years [Metro Adelaide: 9.8%] • 6.0% were employed [Metro Adelaide 54%] • 73.7% main source of income was Govt. assistance • 36.9% no access to a car [Metro Adelaide 11%]
2. Culture & Housing • 6.8% identified as being of ATSI origin [Metro Adelaide: 1.0%] with 10.9% of children being identified as of ATSI origin • Most residents were renting their homes from the SAHT (55.8%) [Metro Adelaide: 8.0%] 24.5% are in private rental accommodation [Metro Adelaide: 17.3%] – so ownership < 20% • Housing Mobility - 34.1%had lived at their current address < 1 year; 69.4% < 5 years [Metro Adelaide: <1 yr, 10.2% <5 yr, 26.4%]
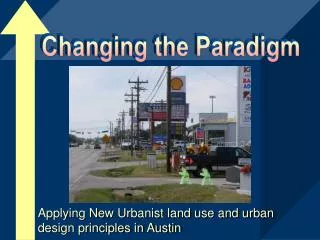
Safety & neighbourhood conditions- newly vacated house vandalised
3. Perceptions of Neighbourhood Safety & Trust(2001/2002 Data) Perceptions of safety & trust (scale 1- 4) Questions about whether others could be trusted and about how safe they felt • No suburb had scores indicating residents felt safe or trusted others much– 1.9 average • Also little variation of opinion on these variables - range 1.7 to 2.4 (SD between 0.03 and 0.9) • Single parents with ONE adult in house – expressed lowest levels of trust in others and general feelings of safety
Social disorder in the suburbs • Garage and bus-stop vandalised
4. RISK – the Stats on Crime in the Suburbs (SAPOL data base 2000) • Rates per 1,000 for crimes in 2000 in the suburbs studied, c.f. overall Adelaide Metro rates: • Property crimes 263 c.f. 131 • Personal attacks 40 c.f. 13 • Sexual attacks 6 c.f. 1 • General law & order 45 c.f. 19 • Drugs 81 c.f. 3 So low trust & perceptions of risk have a reality base in actual crime rates
5. Collective Efficacy as a Construct Collective efficacy is a measure of two fields of perception: (Sampson 1997) Informal social control • How likely people are to take action about events in the neighbourhood Social cohesion • Sense of connection and agreement with others in neighbourhood
Neighbourhoods & Informal Social Control • Vacant house vandalised in SA
6. Synthesis • Low levels of trust, Informal social control, combine with risk (i.e. crime)& other factors to lower social connection • Other factors -Sole parents (46%), and residential mobility (74% moving several times in last 5 years) are factors that lower levels of social connection
7. Conclusions • The combined picture of low safety&trust, high mobility and sole parenting, low collective efficacy andhighrisk from crime rates calls for targeted intervention • Government services need to aim to build stronger, safer communities and to provide better supports for sole parents (education pathways, parenting support) • Children are the nation’s future and require intelligent investment by all sectors of government