Download
1 / 1
10 likes | 127 Vues
Major sources of model uncertainty in the AMF calculation are the shape factor, aerosols, clouds, and the surface albedo. We assess the effects of each of these individually using sensitivity calculations.

E N D
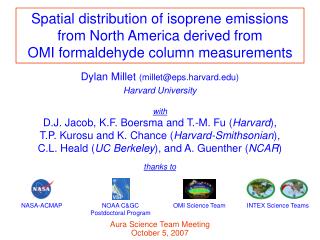
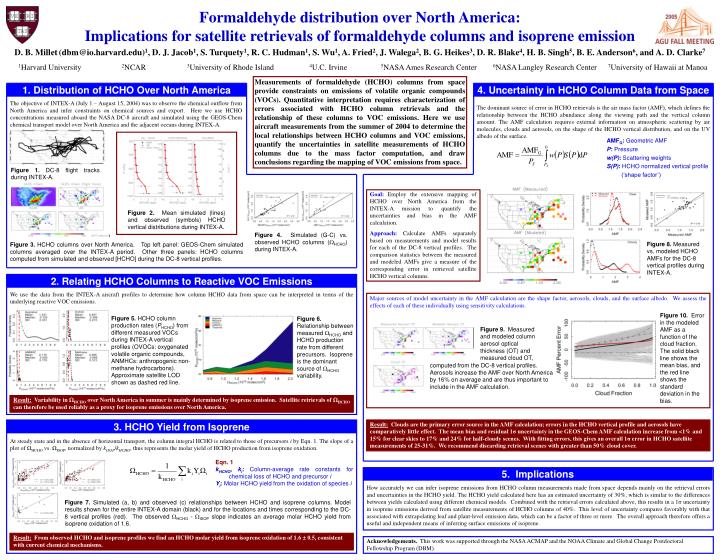
Major sources of model uncertainty in the AMF calculation are the shape factor, aerosols, clouds, and the surface albedo. We assess the effects of each of these individually using sensitivity calculations. Figure 10. Error in the modeled AMF as a function of the cloud fraction. The solid black line shows the mean bias, and the red line shows the standard deviation in the bias. Figure 9. Measured and modeled column aerosol optical thickness (OT) and measured cloud OT, computed from the DC-8 vertical profiles. Aerosols increase the AMF over North America by 16% on average and are thus important to include in the AMF calculation. Formaldehyde distribution over North America: Implications for satellite retrievals of formaldehyde columns and isoprene emission D. B. Millet(dbm@io.harvard.edu)1, D. J. Jacob1, S. Turquety1, R. C. Hudman1, S. Wu1, A. Fried2, J. Walega2, B. G. Heikes3, D. R. Blake4, H. B. Singh5, B. E. Anderson6, and A. D. Clarke7 Measurements of formaldehyde (HCHO) columns from space provide constraints on emissions of volatile organic compounds (VOCs). Quantitative interpretation requires characterization of errors associated with HCHO column retrievals and the relationship of these columns to VOC emissions.Here we use aircraft measurements from the summer of 2004 to determine the local relationships between HCHO columns and VOC emissions,quantify the uncertainties in satellite measurements of HCHO columns due to the mass factor computation, and draw conclusions regarding the mapping of VOC emissions from space. 1. Distribution of HCHO Over North America 4. Uncertainty in HCHO Column Data from Space The objective of INTEX-A (July 1 – August 15, 2004) was to observe the chemical outflow from North America and infer constraints on chemical sources and export. Here we use HCHO concentrations measured aboard the NASA DC-8 aircraft and simulated using the GEOS-Chem chemical transport model over North America and the adjacent oceans during INTEX-A. The dominant source of error in HCHO retrievals is the air mass factor (AMF), which defines the relationship between the HCHO abundance along the viewing path and the vertical column amount. The AMF calculation requires external information on atmospheric scattering by air molecules, clouds and aerosols, on the shape of the HCHO vertical distribution, and on the UV albedo of the surface. AMFG: Geometric AMF P: Pressure w(P): Scattering weights S(P): HCHO normalized vertical profile (‘shape factor’) Figure 1. DC-8 flight tracks during INTEX-A. Goal: Employ the extensive mapping of HCHO over North America from the INTEX-A mission to quantify the uncertainties and bias in the AMF calculation. Approach: Calculate AMFs separately based on measurements and model results for each of the DC-8 vertical profiles. The comparison statistics between the measured and modeled AMFs give a measure of the corresponding error in retrieved satellite HCHO vertical columns. Figure 2. Mean simulated (lines) and observed (symbols) HCHO vertical distributions during INTEX-A. Figure 4. Simulated (G-C) vs. observed HCHO columns (HCHO) during INTEX-A. Figure 8.Measured vs. modeled HCHO AMFs for the DC-8 vertical profiles during INTEX-A. Figure 3. HCHO columns over North America. Top left panel: GEOS-Chem simulated columns averaged over the INTEX-A period. Other three panels: HCHO columns computed from simulated and observed [HCHO] during the DC-8 vertical profiles. 2. Relating HCHO Columns to Reactive VOC Emissions We use the data from the INTEX-A aircraft profiles to determine how column HCHO data from space can be interpreted in terms of the underlying reactive VOC emissions. Figure 5. HCHO column production rates (PHCHO) from different measured VOCs during INTEX-A vertical profiles (OVOCs: oxygenated volatile organic compounds, ANMHCs: anthropogenic non-methane hydrocarbons). Approximate satellite LOD shown as dashed red line. Figure 6. Relationship between measured HCHO and HCHO production rate from different precursors. Isoprene is the dominant source of HCHO variability. Result: Variability in HCHO over North America in summer is mainly determined by isoprene emission. Satellite retrievals of HCHO can therefore be used reliably as a proxy for isoprene emissions over North America. 3. HCHO Yield from Isoprene Result: Clouds are the primary error source in the AMF calculation; errors in the HCHO vertical profile and aerosols have comparatively little effect. The mean bias and residual 1σ uncertainty in the GEOS-Chem AMF calculation increase from <1% and 15% for clear skies to 17% and 24% for half-cloudy scenes. With fitting errors, this gives an overall 1σ error in HCHO satellite measurements of 25-31%. We recommend discarding retrieval scenes with greater than 50% cloud cover. At steady state and in the absence of horizontal transport, the column integral HCHO is related to those of precursors i by Eqn. 1. The slope of a plot of ΩHCHO vs. ΩISOP, normalized by kISOP/kHCHO, thus represents the molar yield of HCHO production from isoprene oxidation. Eqn. 1 kHCHO, ki: Column-average rate constants for chemical loss of HCHO and precursor i Yi: Molar HCHO yield from the oxidation of species i 5. Implications How accurately we can infer isoprene emissions from HCHO column measurements made from space depends mainly on the retrieval errors and uncertainties in the HCHO yield. The HCHO yield calculated here has an estimated uncertainty of 30%, which is similar to the differences between yields calculated using different chemical models. Combined with the retrieval errors calculated above, this results in a 1σ uncertainty in isoprene emissions derived from satellite measurements of HCHO columns of 40%. This level of uncertainty compares favorably with that associated with extrapolating leaf and plant-level emission data, which can be a factor of three or more. The overall approach therefore offers a useful and independent means of inferring surface emissions of isoprene. Figure 7.Simulated (a, b) and observed (c) relationships between HCHO and isoprene columns. Model results shown for the entire INTEX-A domain (black) and for the locations and times corresponding to the DC-8 vertical profiles (red). The observed HCHO - ISOP slope indicates an average molar HCHO yield from isoprene oxidation of 1.6. Result: From observed HCHO and isoprene profiles we find an HCHO molar yield from isoprene oxidation of 1.6 ± 0.5, consistent with current chemical mechanisms. Acknowledgements. This work was supported through the NASA ACMAP and the NOAA Climate and Global Change Postdoctoral Fellowship Program (DBM).