Download
1 / 36
370 likes | 628 Vues
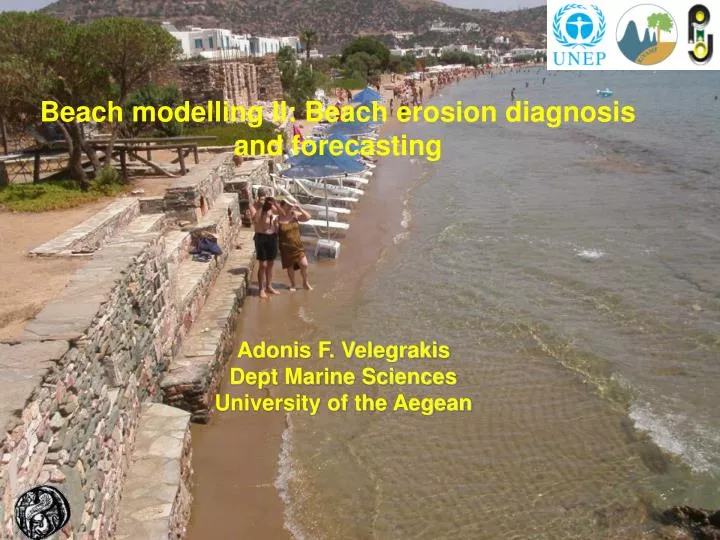
Beach modelling II: Beach erosion diagnosis and forecasting. Adonis F. Velegrakis Dept Marine Sciences University of the Aegean. Synopsis. 1 Beach Characteristics 1.1 Beach morphology 1.2 Beach sediments 1.3 Beach energetics 2 Beach Dynamics 2.1 Changes in different scales

E N D
Beach modelling II: Beach erosion diagnosis and forecasting Adonis F. Velegrakis Dept Marine Sciences University of the Aegean
Synopsis • 1 Beach Characteristics • 1.1 Beach morphology • 1.2 Beach sediments • 1.3 Beach energetics • 2 Beach Dynamics • 2.1 Changes in different scales • 2.2Sea level rise and coastal erosion • 3 Beach erosion diagnosis and forecasting • 3.1 The need for beach morphodynamic models • 3.2 Models and reality
1. 1Beach Characteristics: Morphology • Beach (cross-shore) profile is differentiated into: (i) a sub-aerial and (ii) a submarine section. • The major morphological features of the submarine beach are • the ‘longshore’ bar and • the ‘longshore’ trough. • Under particular energetic conditions may form none or more than one pair of the above features • The major morphological features of the sub-aerial beach are • the beach berm, i.e. a beach sediment deposit the position/height of which is controlled by beach hydrodynamics and • the backshore, which is mostly controlled by beach aerodynamics (occurrence of dunes) • The offshore boundary of the beach is defined by the ‘closure depth’
1.2 Beach Characteristics: Sediments Beaches can form on any kind of sediments, in terms of texture and composition. For a beach to be in equilibrium, inputs and outputs should be balanced It must be also stressed that (submarine) beach sediments may host benthic assemblages (e.g. seagrasses, algae) that can attenuate the incoming wave energy, affect sediment mobility and ultimately affect beach morphodynamics
1.3 Beach Characteristics: Energetics The energetic control on beaches is (mainly) by waves and wave-induced currents. Coastal waves and wave–induced currents are controlled by water depth Other hydrodynamic controls include • Coastal tidal currents (meso- and macro-tidal beaches) • Wind-generated and density currents • Relaxation currents, following storm surges Note: In meso-and macro-tidal environments, the distribution of the wave energy is controlled by the tidal cycle.
2.1 Beach Dynamics: Changes in different scales Beaches show large spatio-temporal variability Adjacent beach sections can show different profiles due to spatial variability in the incoming wave energy. There are also significant morphological changes in various temporal scales Changes in beach morphology are precipitated by changes in the impinging wave energy and sediment budgets. These are characterised by periodicity (daily, seasonal, interannual, decadal etc) and/or randomness. Periodic changes can be very substantial, with the most common being the seasonal (transient) changes: Erosion at the sub-aerial (berm/dune) and deposition at the sub-marine beach with construction of bars and troughs Winter (high energy density Ε=1/8ρgH2), waves of high steepness γ = H/L Summer (low energy density Ε=1/8ρgH2), waves of low steepness (γ = H/L) Erosion at the sub-marine (inshore bars and troughs) and deposition at the sub-aerial beach (berm construction). If, however, the beach suffers a large winter erosion, it might not recover fully in the following summer, with the erosion becoming permanent
2.2 Sea level rise and beach erosion One of the most potent forcing of beach erosion is sea level rise Sea level rise can operate in various temporal scales, i.e. • can be gradual and permanent (ASLR) and/or • rapid and reversible (due to storm surges) Both can have devastating effects
3 Beach erosion diagnosis and forecasting There must be a differentiation between long-term beach erosion and coastal assets/infrastructure inundation/destruction risks due to short-term beach erosion from storms/storm surges In order to identify/quantify long-term beach retreat/erosion, long and comprehensive beach morphological time-series must be acquired, due to high short-term variability of beach morphology Snapshots of shoreline positions/beach morphology can be misleading (even if tidally-corrected).
3.1 The need for models Morphodynamic models are necessary tools to get a diagnosis of beach erosion, as they can test different forcings and controlling parameters (e.g. sea level, wave characteristics, bed slopes and forms, sediments etc) Moreover, morphodynamic models are the only available tools to perform predictions on future beach response Nevertheless, it must be kept in mind that as the ‘map is not the terrain’, ‘models are not reality’
3.2 Models and reality In order morphodynamic models to be manageable in terms of algorithm simplicity/computation time, forcing options, etc they must deal with a simplified version of reality Although this is not necessarily bad, it may ignore very important processes (e.g. the presence/distribution of various seabed roughness elements such as ripples and sea grass meadows, bed armouring effects, storm group effects, etc) that may change significantly model outputs For example, beach retreat/erosion has been, in many cases, significantly underestimated by models
Fig. 1 The beach profile: Morphological features and wave zones (Open University, 1997).
Fig. 2 Position of the thalweg of the longshore trough relative to the location of the wave breaking zone (lt). (So, beach slope; Hb, wave breaking height; T, wave period, L∞, offshore wave length). The bar crest is located at a distance lc from the thalweg of the trough lc = 0.18 Hb(lt/ Hb )3/2(Komar, 1998)
Fig.3 Multiple pairs of longshore bars and triughs in the US Gulf coast (Komar, 1998)
Fig.4 Berm scarp in S. Californiabeach in late September. The scarp evidences seasonal erosion due to storm event of the berm developed in summer.
Fig. 5 Berm height according to the wave characteristics. Hb, wave breaking height; T, wave period, L∞, offshore wave length. (Komar, 1998)
Fig. 6 Sand dunes at the Christchurch beach backshore (New Zealand). These dunes are controlled by the beach aerodynamics and have been stabilised by vegetation SEPM, 1996
Fig. 7 The huge coastal dune of Arcachon, W. France (Dune de Pyla) (J-P. Tastet, 2005
Fig 8 Coastal sand dunes may migrate (transgress) . (SEPM, 1996).
Fig. 9Dunes can, however, be eroded by large storms (a) storm-induced dune erosion (b) dune erosion in N. Carolina due to storms (USGS, 2003)
The closure depth The closure depth forms the beach offshore boundary, i.e. the offshore limit of the beach sediment reservoir. Beach sediments that are transported beyond this depth are lost forever, i.e. they can never come back to replenish the beach. The closure depth hc can be estimated through: hc = α He –β(He2/gTe2) Where He και Teare the height and period of larger storm waves of the year, and the α and β are 1.75-2.28 and 58-68.5, respectively (Komar, 1998). This expression has been calibrated in N. Carolina beaches and, thus, should be used with care in other beaches.
(a) (c) (d) (b) Fig. 10 (a) Gravel beach in N. Zealand (b) shell beach (c) black sand beach in N. Zealand, rich in ilmenite (Ti mineral) and magnetite (Fe mineral) (d) Green Island beach, S. Alaska, US, the beach polluted by the Exxon Valdezoil spill (SEPM, 1996)
Beach sediment budget • ‘Income’ • Rivers • Coastal/beach erosion • Aeolian transport to the beach • Marine sediments • Beach replenishment • ‘Expenditure’ • Winter (reversible) offshore transport of beach sediments • Storm (permanent) offshore transport to the shelf and beyond • Sediment entrapment in the back-barrier environments (lagoons) • Beach sediment abstraction • Longshore sediment transport to adjacent beaches
Without meadows With meadows Fig. 11. Reef and seagrass distribution over the Negril (Jamaica) nearshore, and modelled bed shear stress (force per unit area) by the SBEACH model (Larson and Karuss, 1989) along a profile. Offshore wave height (H) 1 m, period (T) 6s). The seagrass meadows spread the wave force on wider area.
Fig. 12. Wave spectra for two close stations (distance 9 m) along a flat part of a beach profile (water depth 1.3 m) at Vatera beach , E. Mediterranean, showing the attenuation of the wave energy due to the presence of vegetation; modelled attenuation due to the distance covered by the incoming waves is much less. Solid, blue line corresponds to the offshore station. (Vousdoukas et al, submitted)
Fig. 13. Waves (a) and wave-induced current components (b,c,d) at a beach (depth 1.4 m). Vousdoukas et al., submitted
Fig. 14 Coastal wave zones. Longshore transport in the coastal zone occurs mainly in the surf and swash (wave run up) zones(After SEPM, 1996). Key: h, water depth; H, wave height; L, wave length.
Fig. 15. Wave spectra for the same station on a South Wales sand beach (no vegetation), taken at different stages of a tide. As the water level increases, the characteristics of wave energy affecting the seabed also change(Voulgaris, 1992)
Fig. 16 Beach changes in different spatio-temporal scales (Sunamura, 1989?)
Fig.18 Seasonal changes in beach morphology (profile)(Komar, 1998)
Fig. 19 Schema showing the beach response to sea level rise. For a level increase α, sediments from the shoreface are eroded and transported to the submarine section of the beach, resulting to a coastal retreat s.
Fig. 20 Beach response to storms/storm surges. Beaches respond with retreat, sub-aerial beach erosion, profile flattening and deposition at the sub-marine beach. This response results in the gradual attenuation of the incoming wave energy, due to the reduction of the nearshore water depths (remember the Le Chatelier principle?). Nevertheless, the effects on coastal assets/infrastructure close to the coastline can be devastating. After Pilkey & Thieler (1992) and USGS (2003)
Fig. 21 Beach profiles at 5 monitoring stations see inset for location) along an E. Med beach, showing high seasonal variability. (Velegrakis et al., 2008)
Fig. 22 Results of morphodynamic models Leont’yev (1996) και SBEACH (Larson and Krauss, 1989) for the upper part of a linear and a natural cross-section (‘mean΄ section of Delilah experiment, US Army Corps of Engineers) for 3 m waves and sediments with d50 = 0.2 mm and sea level rise of 0.10, 0.22 και 0.50 m. (A) Leont’yevmodel (linear profile, slope 1/10), (Β) SBEACHmodel (linear profile, slope 1/10) (Γ) Leont’yevmodel (‘mean’ profile Delilah) και (Δ) SBEACHmodel (‘mean’ profile Delilah). (Monioudi et al., 2008). x-axis, distance from the origin of the model application; y-axis, elevation
Table 1. Observations versus model predictions (Monioudi, 2011)