Download

1 / 32
330 likes | 596 Vues
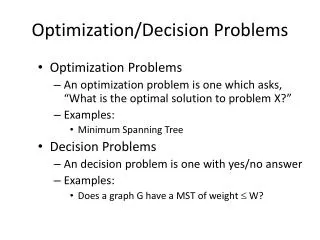
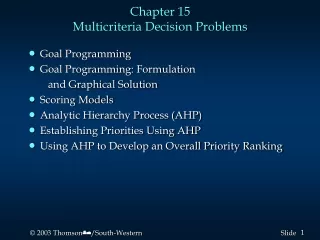
Chapter 15 Multicriteria Decision Problems. Goal Programming Goal Programming: Formulation and Graphical Solution Scoring Models Analytic Hierarchy Process (AHP) Establishing Priorities Using AHP Using AHP to Develop an Overall Priority Ranking. Analytic Hierarchy Process.

E N D
Chapter 15Multicriteria Decision Problems • Goal Programming • Goal Programming: Formulation and Graphical Solution • Scoring Models • Analytic Hierarchy Process (AHP) • Establishing Priorities Using AHP • Using AHP to Develop an Overall Priority Ranking
Analytic Hierarchy Process Analytic Hierarchy Process (AHP), Adalah prosedur yang dirancang untuk meng-angkakan pertimbangan manajerial kepentingan relatif dari setiap kriteria-kriteria yang memiliki arah dan kegunaan berbeda dalam pengambilan keputusan.
Analytic Hierarchy Process • Step 1: Daftarkan semua tujuan, kriteria dan laternatif keputusan. • Step 2: Buatlah matrix perbandingan pairwise (berpasangan) Tetapkan nilai tingkat kepentingan relatif antara setiap pasangan dari alternatif keputusan. The matrix lists the alternatives horizontally and vertically and has the numerical ratings comparing the horizontal (first) alternative with the vertical (second) alternative. nilai tingkat adalah sbb: . . . continued ------- For each criterion, perform steps 2 through 5 -------
Analytic Hierarchy Process • Step 2: Pairwise Comparison Matrix (continued) Compared to the second alternative, the first alternative is: Numerical rating Dipilih ekstrem 9 Dipilih secara sangat kuat 7 dipilih kuat 5 dipilih moderat 3 dipilih secara sama 1
Analytic Hierarchy Process • Step 2: Pairwise Comparison Matrix (continued) Nilai tingkat angka antara yaitu 8, 6, 4, 2 dapat di ikutkan. A reciprocal rating (i.e. 1/9, 1/8, etc.) is assigned when the second alternative is preferred to the first. The value of 1 is always assigned when comparing an alternative with itself.
Analytic Hierarchy Process • Step 3: Develop a Normalized Matrix bagilah setiap angka di dalam sebuah kolom dari matrix perbandingan pairwise (berpasangan) dengan jumlah kolomnya. • Step 4: Develop the Priority Vector Rata ratakan setiap baris dalam normalized matrix. Hal ini membentuk vector prioritas dari pilihan alternatif dikaitkan dengan kriteria tertentu, jumlah vector adalah 1.
Analytic Hierarchy Process • Step 5: Calculate a Consistency Ratio Konsistensi masukan subyektif dalam pairwise matrix dapat diukur dengan menghitung ratio konsistensi. A consistency ratio of less than .1 is good. Untuk rasio yang lebih dari 0.1 maka harus di evaluasi kembali. • Step 6: Develop a Priority Matrix Setelah steps 2 through 5 telah dikerjakan untuk semua kriteria, hasil dari step 4 dijumlahkan dalam sebuah matrix priority dengan mendaftarkan pilihan keputusan (alternatif keputusan) secara horisontal dan kriteria secara vertikal. Masukan dalam kolom adalah vektor vektor prioritas dari setiap kriteria.
Analytic Hierarchy Process • Step 7: Develop a Criteria Pairwise Development Matrix Sama dengan bagian awal saja. This is done in the same manner as that used to construct alternative pairwise comparison matrices by using subjective ratings (step 2). Similarly, normalize the matrix (step 3) and develop a criteria priority vector (step 4). • Step 8: Develop an Overall Priority Vector Multiply the criteria priority vector (from step 7) by the priority matrix (from step 6).
Determining the Consistency Ratio • Step 1: For each row of the pairwise comparison matrix, determine a weighted sum by summing the multiples of the entries by the priority of its corresponding (column) alternative. • Step 2: For each row, divide its weighted sum by the priority of its corresponding (row) alternative. • Step 3: Determine the average, max, of the results of step 2.
Determining the Consistency Ratio • Step 4: Compute the consistency index, CI, of the n alternatives by: CI = (max - n)/(n - 1). • Step 5: Determine the random index, RI, as follows: Number of Random Number of Random Alternative (n)Index (RI)Alternative (n)Index (RI) 3 0.58 6 1.24 4 0.90 7 1.32 5 1.12 8 1.41 • Step 6: Compute the consistency ratio: CR = CR/RI.
Example: Gill Glass Designer Gill Glass must decide which of three manufacturers will develop his "signature" toothbrushes. Three factors seem important to Gill: (1) his costs; (2) reliability of the product; and, (3) delivery time of the orders. The three manufacturers are Cornell Industries, Brush Pik, and Picobuy. Cornell Industries will sell toothbrushes to Gill Glass for $100 per gross, Brush Pik for $80 per gross, and Picobuy for $144 per gross. Gill has decided that in terms of price, Brush Pik is moderately preferred to Cornell and very strongly preferred to Picobuy. In turn Cornell is strongly to very strongly preferred to Picobuy.
Example: Gill Glass • Hierarchy for the Manufacturer Selection Problem Overall Goal Select the Best Toothbrush Manufacturer Criteria Cost Reliability Delivery Time Cornell Brush Pik Picobuy Cornell Brush Pik Picobuy Cornell Brush Pik Picobuy Decision Alternatives
Example: Gill Glass • Forming the Pairwise Comparison Matrix For Cost • Since Brush Pik is moderately preferred to Cornell, Cornell's entry in the Brush Pik row is 3 and Brush Pik's entry in the Cornell row is 1/3. • Since Brush Pik is very strongly preferred to Picobuy, Picobuy's entry in the Brush Pik row is 7 and Brush Pik's entry in the Picobuy row is 1/7. • Since Cornell is strongly to very strongly preferred to Picobuy, Picobuy's entry in the Cornell row is 6 and Cornell's entry in the Picobuy row is 1/6.
Example: Gill Glass • Pairwise Comparison Matrix for Cost Cornell Brush Pik Picobuy Cornell 1 1/3 6 Brush Pik 3 1 7 Picobuy 1/6 1/7 1
Example: Gill Glass • Normalized Matrix for Cost Bagi setiap masukan dalam pairwise comparison matrix dengan jumlah kolom yang terkait. For example, for Cornell the column sum = 1 + 3 + 1/6 = 25/6. This gives: Cornell Brush Pik Picobuy Cornell 6/25 7/31 6/14 Brush Pik 18/25 21/31 7/14 Picobuy 1/25 3/31 1/14
Example: Gill Glass • Priority Vector For Cost The priority vector is determined by averaging the row entries in the normalized matrix. Converting to decimals we get: Cornell: ( 6/25 + 7/31 + 6/14)/3 = .298 Brush Pik: (18/25 + 21/31 + 7/14)/3 = .632 Picobuy: ( 1/25 + 3/31 + 1/14)/3 = .069
Example: Gill Glass • Checking Consistency • Multiply each column of the pairwise comparison matrix by its priority: 1 1/3 6 .923 .298 3 + .632 1 + .069 7 = 2.009 1/6 1/7 1 .209 • Divide these number by their priorities to get: .923/.298 = 3.097 2.009/.632 = 3.179 .209/.069 = 3.029
Example: Gill Glass • Checking Consistency • Average the above results to get max. max = (3.097 + 3.179 + 3.029)/3 = 3.102 • Compute the consistence index, CI, for two terms. CI = (max - n)/(n - 1) = (3.102 - 3)/2 = .051 • Compute the consistency ratio, CR, by CI/RI, where RI = .58 for 3 factors: CR = CI/RI = .051/.58 = .088 CR nya kurang dari 0.1 maka konsisten.
Example: Gill Glass Gill Glass has determined that for reliability, Cornell is very strongly preferable to Brush Pik and equally preferable to Picobuy. Also, Picobuy is strongly preferable to Brush Pik.
Example: Gill Glass • Pairwise Comparison Matrix for Reliability Cornell Brush Pik Picobuy Cornell 1 7 2 Brush Pik 1/7 1 5 Picobuy 1/2 1/5 1
Example: Gill Glass • Normalized Matrix for Reliability Divide each entry in the pairwise comparison matrix by its corresponding column sum. For example, for Cornell the column sum = 1 + 1/7 + 1/2 = 23/14. This gives: Cornell Brush Pik Picobuy Cornell 14/23 35/41 2/8 Brush Pik 2/23 5/41 5/8 Picobuy 7/23 1/41 1/8
Example: Gill Glass • Priority Vector For Reliability The priority vector is determined by averaging the row entries in the normalized matrix. Converting to decimals we get: Cornell: (14/23 + 35/41 + 2/8)/3 = .571 Brush Pik: ( 2/23 + 5/41 + 5/8)/3 = .278 Picobuy: ( 7/23 + 1/41 + 1/8)/3 = .151 • Checking Consistency Gill Glass’ responses to reliability could be checked for consistency in the same manner as was cost.
Example: Gill Glass Gill Glass has determined that for delivery time, Cornell is equally preferable to Picobuy. Both Cornell and Picobuy are very strongly to extremely preferable to Brush Pik.
Example: Gill Glass • Pairwise Comparison Matrix for Delivery Time Cornell Brush Pik Picobuy Cornell 1 8 1 Brush Pik 1/8 1 1/8 Picobuy 1 8 1
Example: Gill Glass • Normalized Matrix for Delivery Time Divide each entry in the pairwise comparison matrix by its corresponding column sum. Cornell Brush Pik Picobuy Cornell 8/17 8/17 8/17 Brush Pik 1/17 1/17 1/17 Picobuy 8/17 8/17 8/17
Example: Gill Glass • Priority Vector For Delivery Time The priority vector is determined by averaging the row entries in the normalized matrix. Converting to decimals we get: Cornell: (8/17 + 8/17 + 8/17)/3 = .471 Brush Pik: (1/17 + 1/17 + 1/17)/3 = .059 Picobuy: (8/17 + 8/17 + 8/17)/3 = .471 • Checking Consistency Gill Glass’ responses to delivery time could be checked for consistency in the same manner as was cost.
Example: Gill Glass The accounting department has determined that in terms of criteria, cost is extremely preferable to delivery time and very strongly preferable to reliability, and that reliability is very strongly preferable to delivery time.
Example: Gill Glass • Pairwise Comparison Matrix for Criteria Cost Reliability Delivery Cost 1 7 9 Reliability 1/7 1 7 Delivery 1/9 1/7 1
Example: Gill Glass • Normalized Matrix for Criteria Divide each entry in the pairwise comparison matrix by its corresponding column sum. Cost Reliability Delivery Cost 63/79 49/57 9/17 Reliability 9/79 7/57 7/17 Delivery 7/79 1/57 1/17
Example: Gill Glass • Priority Vector For Criteria The priority vector is determined by averaging the row entries in the normalized matrix. Converting to decimals we get: Cost: (63/79 + 49/57 + 9/17)/3 = .729 Reliability: ( 9/79 + 7/57 + 7/17)/3 = .216 Delivery: ( 7/79 + 1/57 + 1/17)/3 = .055
Example: Gill Glass • Overall Priority Vector The overall priorities are determined by multiplying the priority vector of the criteria by the priorities for each decision alternative for each objective. Priority Vector for Criteria [ .729 .216 .055 ] Cost Reliability Delivery Cornell .298 .571 .471 Brush Pik .632 .278 .059 Picobuy .069 .151 .471
Example: Gill Glass • Overall Priority Vector (continued) Thus, the overall priority vector is: Cornell: (.729)(.298) + (.216)(.571) + (.055)(.471) = .366 Brush Pik: (.729)(.632) + (.216)(.278) + (.055)(.059) = .524 Picobuy: (.729)(.069) + (.216)(.151) + (.055)(.471) = .109 Brush Pik appears to be the overall recommendation.