Download
1 / 1
10 likes | 238 Vues
12. 12. 12. 12. 12. 12. 20. 20. 10. 10. 10. 10. 10. 10. 10. 10. 8. 8. 8. 8. 8. 8. 0. 0. Height AGL (km). Height AGL (km). Height AGL (km). Height AGL (km). Height AGL (km). Height AGL (km). 6. 6. 6. 6. 6. 6. Generating Cells ~ 1-1.5 km in Length. 4. 4. 4. 4.

E N D
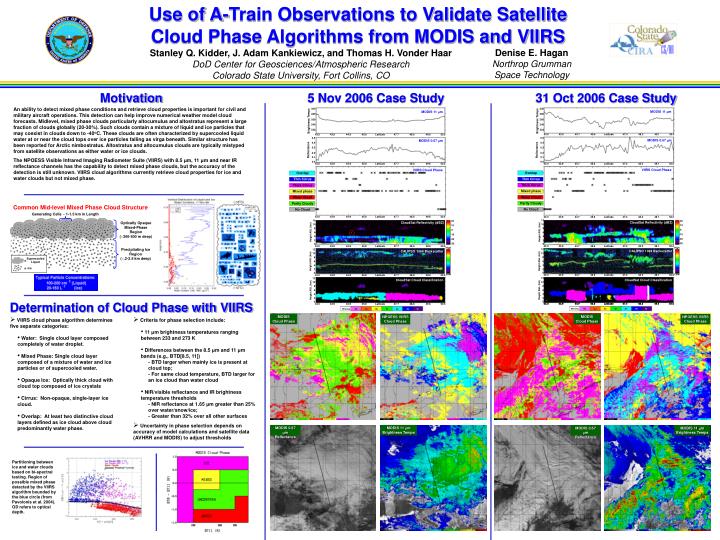
12 12 12 12 12 12 20 20 10 10 10 10 10 10 10 10 8 8 8 8 8 8 0 0 Height AGL (km) Height AGL (km) Height AGL (km) Height AGL (km) Height AGL (km) Height AGL (km) 6 6 6 6 6 6 Generating Cells ~ 1-1.5 km in Length 4 4 4 4 4 4 2 2 2 2 2 2 0 0 0 0 0 0 Optically Opaque Mixed-Phase Region (~300-500 m deep) 43.0 43.0 43.0 43.0 43.0 43.0 43.0 43.0 43.0 43.0 43.0 43.0 43.0 43.9 43.9 43.9 43.9 43.9 43.9 43.9 43.9 43.9 43.9 43.9 43.9 43.9 44.9 44.7 44.7 44.9 44.7 44.9 44.9 44.9 44.7 44.7 44.9 44.9 44.7 45.8 45.8 45.8 45.8 45.8 45.6 45.6 45.6 45.8 45.6 45.8 45.6 45.6 Latitude Latitude Latitude Latitude Latitude Latitude Latitude Latitude Latitude Latitude Latitude Latitude Latitude 47.4 47.4 47.4 47.7 47.4 47.7 47.7 47.7 47.4 47.7 47.7 47.7 47.4 48.2 48.6 48.6 48.6 48.2 48.2 48.2 48.6 48.6 48.2 48.5 48.6 48.2 49.6 49.1 49.6 49.6 49.1 49.6 49.1 49.1 49.6 49.6 49.1 49.1 49.6 50.0 50.5 50.5 50.0 50.0 50.0 50.0 50.5 50.5 50.5 51.5 50.0 50.5 Denise E. Hagan Northrop Grumman Space Technology Stanley Q. Kidder, J. Adam Kankiewicz, and Thomas H. Vonder Haar DoD Center for Geosciences/Atmospheric Research Colorado State University, Fort Collins, CO Precipitating Ice Region (~.2-2.5 km deep) Missing Missing Ns Ns Cu Cu Sc Sc St St Ac Ac As As Ci Ci MODIS 11 mm MODIS 11 mm MODIS 0.67 mm MODIS 0.67 mm 300 300 280 280 260 260 VIIRS Cloud Phase VIIRS Cloud Phase Brightness Temps Brightness Temps 240 240 220 220 0.5 0.5 0.4 0.4 0.3 0.3 Reflectance Reflectance 0.2 0.2 0.1 0.1 0.0 0.0 Overlap Overlap CloudSat Reflectivity (dBZ) Thin Cirrus Thin Cirrus Thick Cirrus Thick Cirrus -10 Mixed phase Mixed phase -20 Water Cloud Water Cloud -30 Supercooled Liquid = High Partly Cloudy Partly Cloudy CALIPSO 1064 Backscatter = Ice No Cloud No Cloud CloudSat Reflectivity (dBZ) Low CloudSat Cloud Classification -10 -20 -30 High CALIPSO 1064 Backscatter Low CloudSat Cloud Classification MODIS 11 mm Brightness Temps 0oC -10oC -20oC -30oC -40oC -50oC 0oC -10oC -20oC -30oC -40oC Use of A-Train Observations to Validate Satellite Cloud Phase Algorithms from MODIS and VIIRS Motivation 5 Nov 2006 Case Study 31 Oct 2006 Case Study An ability to detect mixed phase conditions and retrieve cloud properties is important for civil and military aircraft operations. This detection can help improve numerical weather model cloud forecasts.Midlevel, mixed phase clouds particularly altocumulus and altostratus represent a large fraction of clouds globally (20-30%). Such clouds contain a mixture of liquid and ice particles that may coexist in clouds down to -40oC. These clouds are often characterized by supercooled liquid water at or near the cloud tops over ice particles falling as virga beneath. Similar structure has been reported for Arctic nimbostratus. Altostratus and altocumulus clouds are typically mistyped from satellite observations as either water or ice clouds. The NPOESS Visible Infrared Imaging Radiometer Suite (VIIRS) with 8.5 μm, 11 μm and near IR reflectance channels has the capability to detect mixed phase clouds, but the accuracy of the detection is still unknown. VIIRS cloud algorithms currently retrieve cloud properties for ice and water clouds but not mixed phase. Common Mid-level Mixed Phase Cloud Structure Determination of Cloud Phase with VIIRS • Criteria for phase selection include: • 11 μm brightness temperatures ranging between 233 and 273 K • Differences between the 8.5 μm and 11 μm bands (e.g., BTD[8.5, 11]) - BTD larger when mainly ice is present at cloud top; - For same cloud temperature, BTD larger for an ice cloud than water cloud • NIR/visible reflectance and IR brightness temperature thresholds • - NIR reflectance at 1.65 μm greater than 25% over water/snow/ice; • - Greater than 32% over all other surfaces • Uncertainty in phase selection depends on accuracy of model calculations and satellite data (AVHRR and MODIS) to adjust thresholds MODIS Cloud Phase MODIS Cloud Phase NPOESS VIIRS Cloud Phase NPOESS VIIRS Cloud Phase • VIIRS cloud phase algorithm determines five separate categories: • Water: Single cloud layer composed completely of water droplet. • Mixed Phase: Single cloud layer composed of a mixture of water and ice particles or of supercooled water. • Opaque Ice: Optically thick cloud with cloud top composed of ice crystals • Cirrus: Non-opaque, single-layer ice cloud. • Overlap: At least two distinctive cloud layers defined as ice cloud above cloud predominantly water phase. MODIS 0.67 mm Reflectance MODIS 0.67 mmReflectance MODIS 11 mm Brightness Temps Partitioning between ice and water clouds based on bi-spectral testing. Region of possible mixed phase detected by the VIIRS algorithm bounded by the blue circle (from Pavolonis et al. 2004). OD refers to optical depth. -40oC -40oC