Download
1 / 1
10 likes | 189 Vues
BOLCHEM AIR QUALITY MODEL: PERFORMANCE EVALUATION OVER ITALY. Alberto Maurizi 1, Mihaela Mircea 1 , Massimo D'Isidoro 1 , Lina Vitali 2 , Fabio Monforti 2 , Gabriele Zanini 2 , Francesco Tampieri 1

E N D
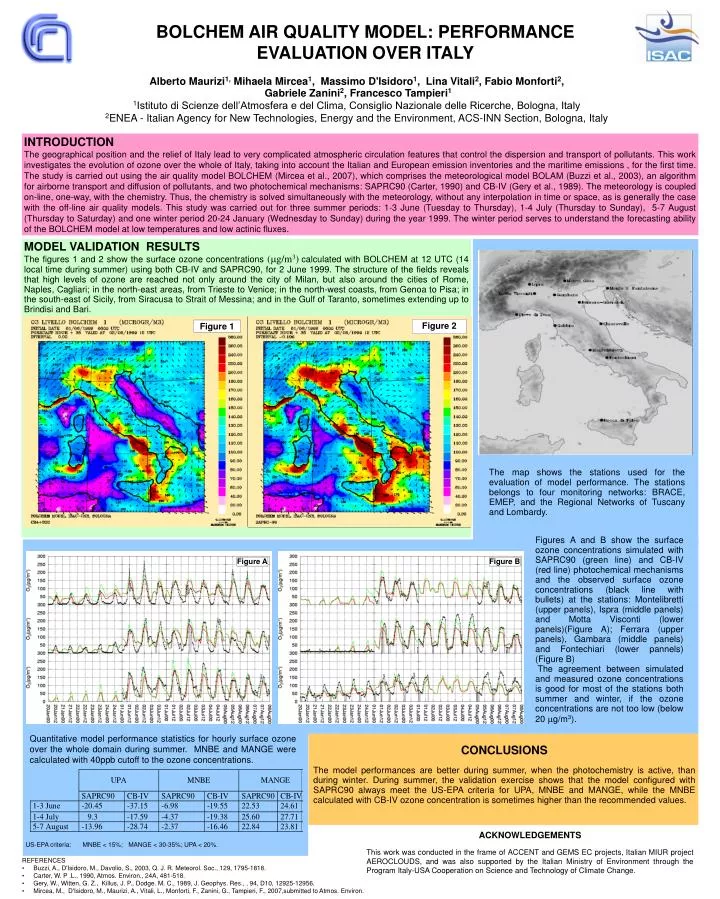
BOLCHEM AIR QUALITY MODEL: PERFORMANCE EVALUATION OVER ITALY Alberto Maurizi1, Mihaela Mircea1, Massimo D'Isidoro1, Lina Vitali2, Fabio Monforti2, Gabriele Zanini2, Francesco Tampieri1 1Istituto di Scienze dell’Atmosfera e del Clima, Consiglio Nazionale delle Ricerche, Bologna, Italy 2ENEA - Italian Agency for New Technologies, Energy and the Environment, ACS-INN Section, Bologna, Italy INTRODUCTION The geographical position and the relief of Italy lead to very complicated atmospheric circulation features that control the dispersion and transport of pollutants. This work investigates the evolution of ozone over the whole of Italy, taking into account the Italian and European emission inventories and the maritime emissions , for the first time. The study is carried out using the air quality model BOLCHEM (Mircea et al., 2007), which comprises the meteorological model BOLAM (Buzzi et al., 2003), an algorithm for airborne transport and diffusion of pollutants, and two photochemical mechanisms: SAPRC90 (Carter, 1990) and CB-IV (Gery et al., 1989). The meteorology is coupled on-line, one-way, with the chemistry. Thus, the chemistry is solved simultaneously with the meteorology, without any interpolation in time or space, as is generally the case with the off-line air quality models. This study was carried out for three summer periods: 1-3 June (Tuesday to Thursday), 1-4 July (Thursday to Sunday), 5-7 August (Thursday to Saturday) and one winter period 20-24 January (Wednesday to Sunday) during the year 1999. The winter period serves to understand the forecasting ability of the BOLCHEM model at low temperatures and low actinic fluxes. MODEL VALIDATION RESULTS The figures 1 and 2 show the surface ozone concentrations (g/m3)calculated with BOLCHEM at 12 UTC (14 local time during summer) using both CB-IV and SAPRC90, for 2 June 1999. The structure of the fields reveals that high levels of ozone are reached not only around the city of Milan, but also around the cities of Rome, Naples, Cagliari; in the north-east areas, from Trieste to Venice; in the north-west coasts, from Genoa to Pisa; in the south-east of Sicily, from Siracusa to Strait of Messina; and in the Gulf of Taranto, sometimes extending up to Brindisi and Bari. Figure 2 Figure 1 The map shows the stations used for the evaluation of model performance. The stations belongs to four monitoring networks: BRACE, EMEP, and the Regional Networks of Tuscany and Lombardy. Figures A and B show the surface ozone concentrations simulated with SAPRC90 (green line) and CB-IV (red line) photochemical mechanisms and the observed surface ozone concentrations (black line with bullets) at the stations: Montelibretti (upper panels), Ispra (middle panels) and Motta Visconti (lower panels)(Figure A); Ferrara (upper panels), Gambara (middle panels) and Fontechiari (lower pannels) (Figure B) The agreement between simulated and measured ozone concentrations is good for most of the stations both summer and winter, if the ozone concentrations are not too low (below 20 g/m3). Figure A Figure B Quantitative model performance statistics for hourly surface ozone over the whole domain during summer. MNBE and MANGE were calculated with 40ppb cutoff to the ozone concentrations. CONCLUSIONS The model performances are better during summer, when the photochemistry is active, than during winter. During summer, the validation exercise shows that the model configured with SAPRC90 always meet the US-EPA criteria for UPA, MNBE and MANGE, while the MNBE calculated with CB-IV ozone concentration is sometimes higher than the recommended values. ACKNOWLEDGEMENTS This work was conducted in the frame of ACCENTand GEMS EC projects, Italian MIUR project AEROCLOUDS, and was also supported by the Italian Ministry of Environment through the Program Italy-USA Cooperation on Science and Technology of Climate Change. US-EPA criteria: MNBE < 15%; MANGE < 30-35%; UPA < 20%. REFERENCES • Buzzi, A., D'Isidoro, M., Davolio, S., 2003, Q. J. R. Meteorol. Soc., 129, 1795-1818. • Carter, W. P .L., 1990, Atmos. Environ., 24A, 481-518. • Gery, W., Witten, G. Z., Killus, J. P., Dodge. M. C., 1989, J. Geophys. Res., , 94, D10, 12925-12956. • Mircea, M., D'Isidoro, M., Maurizi, A., Vitali, L., Monforti, F., Zanini, G., Tampieri, F., 2007,submitted to Atmos. Environ.


