Download
1 / 5
50 likes | 142 Vues
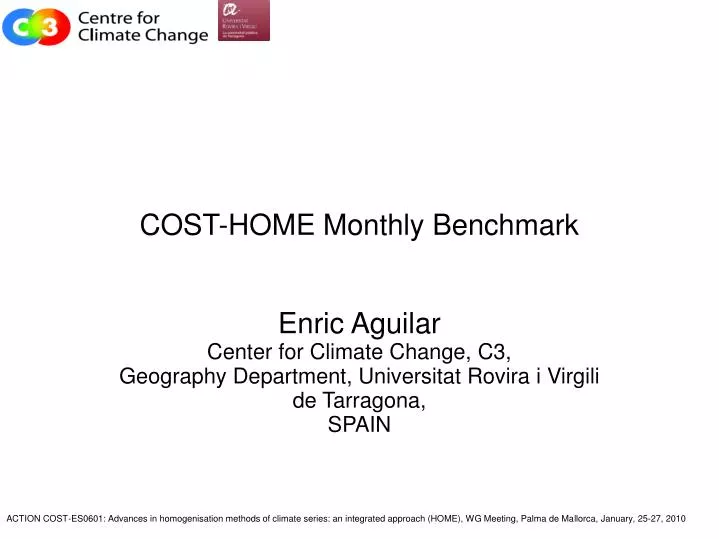
Enric Aguilar Center for Climate Change, C3, Geography Department, Universitat Rovira i Virgili de Tarragona, SPAIN. COST-HOME Monthly Benchmark. C3-SNHT APPLICATION. New software (F95). Detection and taylored correction modules Reference selection (distance, correlation, overlap)

E N D
Enric Aguilar Center for Climate Change, C3, Geography Department, Universitat Rovira i Virgili de Tarragona, SPAIN COST-HOME Monthly Benchmark
C3-SNHT APPLICATION • New software (F95). • Detection and taylored correction modules • Reference selection (distance, correlation, overlap) • One homogenization for station: for each station/element/month-season-annual a special “network” is created and only the results for the main candidate are retained • Series are split until the most recent break is found • It the break is significant and larger than large enough, is retained • If the break is non significant or too small, it is retained • In both cases, if the rest of the series is big enough (i.e. more than X values) the rest of the series is tested) • Breaks need to be inspected and a correction pattern created. This is better done with annual and seasonal averages
OVER THE BENCHMARK • For the benchmark analysis, the less costly procedure (in time has been selected). This is far from the optimal application of the C3 software, but can assess if – even with this scope – he homogeneity of the networks increases or not. • Fully automatic application. No human intervention, only parameters set up (significance level, minimum segment to test, outliers level, minimum factor to consider, etc.) • Each network runs very quick, with a single bash script • R code for results control • No trend detection in automatic mode (although trends are identified and corrected as small, same sign consecutive break)
OVER THE BENCHMARK (II) • Calculation of annual averages • Detection over annual averages (cannot trap some breaks with seasonal cycle) • Creation of correction pattern with breaks detected in annual averages (all breaks assigned to January) • With real datasets, human inspection would be needed after automatic run: • To validate breaks (you know, all that story about metadata ) • To identify trends • To better assign the validated breaks (year/month)
CONCLUSIONS • The very simplified automatic procedure applied to run the benchmark networks seems to improve tho homogeneity of the network • Benchmark results analysis (specially when breakpoint positions, amplitudes, etc. are disclosed) must help to improve the automatic detection • Human intervention improves the detection... usually ;-)