Download
1 / 1
10 likes | 102 Vues
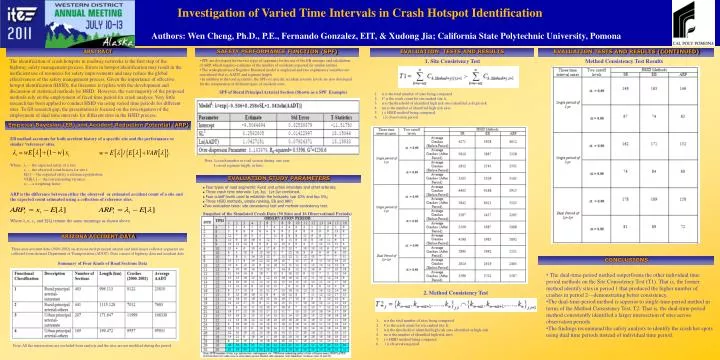
Investigation of Varied Time Intervals in Crash Hotspot Identification Authors: Wen Cheng, Ph.D., P.E., Fernando Gonzalez, EIT, & Xudong Jia; California State Polytechnic University, Pomona. ABSTRACT. SAFETY PERFORMANCE FUNCTION (SPF). EVALUATION TESTS AND RESULTS.

E N D
Investigationof Varied Time Intervals in Crash Hotspot Identification Authors: Wen Cheng, Ph.D., P.E., Fernando Gonzalez, EIT, & Xudong Jia; California State Polytechnic University, Pomona ABSTRACT SAFETY PERFORMANCE FUNCTION (SPF) EVALUATION TESTS AND RESULTS EVALUATION TESTS AND RESULTS (CONTINUED) The identification of crash hotspots in roadway networks is the first step of the highway safety management process. Errors in hotspot identification may result in the inefficient use of resources for safety improvements and may reduce the global effectiveness of the safety management process. Given the importance of effective hotspot identification (HSID), the literature is replete with the development and discussion of statistical methods for HSID. However, the vast majority of the proposed methods rely on the employment of fixed time period for crash analysis. Very little research has been applied to conduct HSID via using varied time periods for different sites. To fill research gap, the presentation is focused on the investigation of the employment of dual time intervals for different sites in the HSID process. • SPF are developed for the two types of segments for the use of the EB estimate and calculation of ARP, which requires estimates of the number of accidents expected on similar entities. • The widespread used Negative Binomial model is employed and two explanatory variables are considered, that is, AADT and segment length. • In addition to the total accidents, the SPFs of specific accident severity levels are also developed for the computation of different types of accident costs. 1. Site Consistency Test Method Consistency Test Results SPF of Rural Principal Arterial Section (Shown as a SPF Example) n is the total number of sites being compared C is the crash count for site ranked site k. α is the threshold of identified high risk sites identified as high-risk nα is the number of identified high risk sites j = HSID method being compared i is observation period . Empirical Bayesian (EB) and Accident Reduction Potential (ARP) EB method accounts for both accident history of a specific site and the performance or similar ‘reference’ sites. Where: λi — the expected safety of a site; xi — the observed count history for site i; E[λ] — the expected safety a reference population; VAR[λ ] — the corresponding variance; w — a weighting factor ARP is the difference between either the observed or estimated accident count of a site and the expected count estimated using a collection of reference sites. Where λiw, xi, and E[λ] remain the same meanings as shown above Note: λ=crash number in road section during one year. L=road segment length, in kms. EVALUATION STUDY PARAMETERS • Four types of road segments: Rural and urban interstate and other arterials; • Three crash time intervals: 1yr, 3yr, 1yr-3yr combined. • Four cutoff levels used to establish the hotspots: top 10% and top 5%; • Three HSID methods, simple ranking, EB and ARP; • Two evaluation tests: site consistency test and method consistency test. Snapshot of the Simulated Crash Data (30 Sites and 16 Observational Periods) ARIZONA ACCIDENT DATA Three-year accident data (2000-2002) on Arizona rural principal arterial and rural major collector segments are collected from Arizona Department of Transportation (ADOT). Data consist of highway data and accident data. Summary of Four Kinds of Road Sections Data CONCLUSIONS • The dual-time-period method outperforms the other individual time period methods on the Site Consistency Test (T1). That is, the former method identify sites in period 1 that produced the higher number of crashes in period 2—demonstrating better consistency. • The dual-time-period method is superior to single-time-period method in terms of the Method Consistency Test, T2. That is, the dual-time-period method consistently identified a larger intersection of sites across observation periods. • The findings recommend the safety analysts to identify the crash hot spots using dual time periods instead of individual time period. 2. Method Consistency Test n is the total number of sites being compared C is the crash count for site ranked site k. α is the threshold of identified high risk sites identified as high-risk nα is the number of identified high risk sites j = HSID method being compared i is observation period . Note: Allthe intersections are excluded from analysis and the sites are not modified during the period..