Download
1 / 33
330 likes | 427 Vues
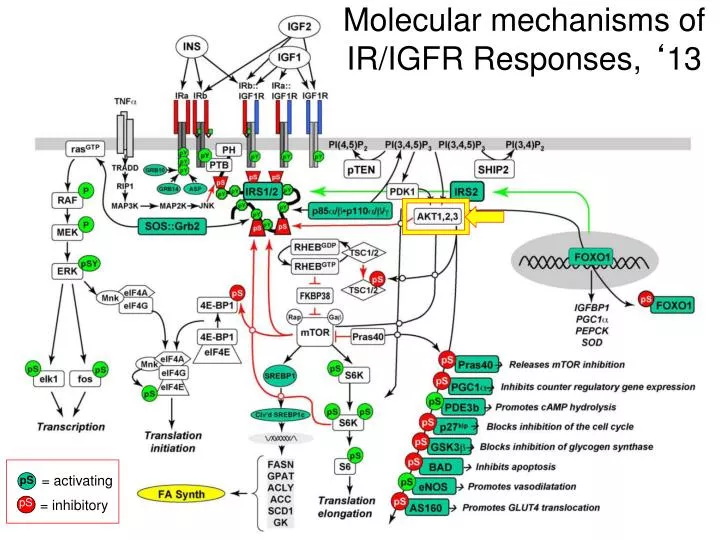
Molecular mechanisms of IR/IGFR Responses, ‘ 13. = activating. pS. pS. = inhibitory. How do we determine the most important “targets”, the timing, the cross regulation, and the “ drugability ” of the various pathways of a signaling cascade?. Phosphoproteomics approaches.

E N D
Molecular mechanisms of IR/IGFR Responses, ‘13 = activating pS pS = inhibitory
How do we determine the most important “targets”, the timing, the cross regulation, and the “drugability” of the various pathways of a signaling cascade? Phosphoproteomics approaches
Dynamic Adipocyte PhosphoproteomeReveals that Akt Directly Regulates mTORC2 Sean J. Humphrey, Guang Yang, Pengyi Yang, Daniel J. Fazakerley, Jacqueline Stockli, Jean Y. Yang, and David E. James Cell Metabolism 17, 1009–1020, June 4, 2013
Beavo Take Home Question 2013 Please read the posted review by Kahn and the research paper by James. 1) For the James’ paper briefly outline your opinion about at least two strengths of the approach that they are using to help further refine the well-studied insulin signaling pathway. 2) Identify what you feel are at least two limitations of the approach that they use and briefly explain your reasoning for saying so. Your answer therefore should have two parts and each part will be graded with approximately equal weight. (One page total please).
SUMMARY A major challenge of the post-genomics era is to define the connectivity of protein phosphorylation networks. Here, we quantitatively delineate the insulin signaling network in adipocytes by high-resolution mass spectrometry-based proteomics. These data reveal the complexity of intracellular protein phosphorylation. We identified 37,248 phosphorylation sites on 5,705 proteins in this single-cell type, with approximately 15% responding to insulin. We integrated these large-scale phosphoproteomicsdata using a machine learning approach to predict physiological substrates of several diverse insulin-regulated kinases. This led to the identification of an Akt substrate, SIN1, a core component of the mTORC2 complex. The phosphorylation of SIN1 by Aktwas found to regulate mTORC2 activity in response to growth factors, revealing topological insights into the Akt/mTOR signaling network. The dynamic phosphoproteome described here contains numerous phosphorylation sites on proteins involved in diverse molecular functions and should serve as a useful functional resource for cell biologists.
Phospho-peptide Enrichment Procedure Protein extract is reduced, alkylated and digested with LysC/Trypsin. Peptides are desalted and separated by SCX (strong cation exchange) chromatography. Each fraction is enriched by IMAC (immobilized metal affinity chromatography) and analyzed by LC-MS/MS.
Fig 1. Quantification of the Insulin-Regulated Phospho-proteome using SILAC Labeling & Tandem Mass Spectrometry Insulin time course PI3K screen (B) Experimental design of temporal phosphoproteome screen. (A) Experimental design of inhibitor screens.
Dynamic Quantitative Analysis of Akt/mTOR Networks Fig 4. (A) Immunoblot analysis of adipocytes following different insulin-stimulated time points for proteins known to belong to the Akt (blue) and mTOR (pink) pathways. (B and C) Temporal profiles generated from SILAC-MS data for known direct Akt (B) and mTOR (C) substrates. (D) Network model depicting the activation of Akt, mTORC1, and mTORC2 by growth factors.
Figure 5. Temporal Phosphorylation in Response to Insulin Reveals Signaling Network Topology Data from the literature were used to construct a cell signaling network. Proteins identified in this study were annotated with their respective insulin-dependent phosphorylation sites color coded according to the temporal patterns derived from unsupervised clustering (fuzzy c-means), shown at the right. Complete clusters (A–R) are shown in Fig S3 and listed in Table S2. See also Figs S4 and S5. Cell Metabolism 17, 1009–1020, June 4, 2013
Fig 6. Aktis the physiological kinase for SIN1 T86, and its phosphorylation directly regulates mTORC2 activity (A) SIN1 domain structure homology of the region surrounding T86. TORC, putative mTORC-binding domain; CC, coiled-coil domain; CRIM, conserved region in the middle domain ; RBD, Raf-like Ras-binding domain; PH, pleckstrin homology domain. Enlarged is the region containing the insulin-responsive phosphorylation site, T86. Residues surrounding several other known Akt substrates (AS160 T642, FOXO1A S256, TSC2 S939 and BAD S99) are shown. (B) Endogenous SIN1 is rapidly phosphorylated in response to insulin and blocked by the Aktallosteric inhibitor MK2206. 3T3-L1 adipocytes were treated with MK2206, and stimulated with insulin, and assessed by immunoblotting. (C) Insulin-stimulated phosphorylation of endogenous SIN1 T86 is blocked by MK2206 and GDC-0068 (Akt competitive inhibitor), but not by rapamycin (R). HEK293 cells were serum starved, treated with MK, GDC8, or rapamycin (50 nM) followed by insulin, and samples were analyzed by immunoblotting. (D) Akt in vitro kinase assay using recombinant GST-Akt results in phosphorylation of SIN1 at T86 and is blocked by GDC. (E) Expression of SIN1, but not SIN1 T86A mutant, in SIN1/ MEFs rescues mTORC2-dependent signaling. SIN1 WT or phosphomutants (T86A, T86E) were expressed in SIN1/ MEFs, selected by FACS,stimulated with insulin, and analyzed by immunoblotting. (F) In vitro kinase activity of endogenous mTORC2 isolated from cells is enhanced by insulin stimulation and blocked by pretreatment with MK2206, but not rapamycin. LY294002 was added directly to the in vitro kinase assay.
Fig 6 (cont). Akt Is the Physiological Kinase for SIN1 T86, and its Phosphorylation Directly Regulates mTORC2 Activity (G) mTORC2 isolated from SIN1/ MEFs reconstituted with SIN1 WT or phosphomutants (T86A, T86E) displays differential growth factor-stimulated kinase activity in in vitro kinase assay, with enhanced mTORC2 activity isolated from T86E hosphomimetic mutants. (H) Model depicting growth factor-dependent activation of mTORC2 mediated by Akt phosphorylation of SIN1. See also Figure S6.
Fig S6. Identification of SIN1 as a Direct AktSubstrate (A) Time-course of SIN1 Thr86 phosphorylation in insulin-stimulated HEK-293T cells. Cells transiently expressing Flag-SIN1 or empty vector were serum starved for 2 h followed by stimulation with insulin (100 nM) for the indicated durations. Flag-SIN1 was immunoprecipitated from cell lysates using the Flag antibody. Immunoprecipitated proteins and total cell lysates were analyzed by immunoblotting using the indicated antibodies. (B) mTORC2 complex formation is not affected by SIN1 Thr86. mTORC2 was immunoprecipitated from SIN1 -/- MEF cells stably expressing SIN1wild type (WT) or SIN1 phospho-mutant (T86A) and samples were analysed by immunoblotting for components of mTORC2 complex. (C) Signalling in SIN1 -/- MEF cells rescued with SIN1 phospho-mutants. Expression of SIN1but not SIN1 T86A mutant in SIN1 null MEFs rescues mTORC2-dependent signalling. SIN1 wild type (WT) or phospho-mutants (T86A, T86E) were expressed in SIN1 -/- MEFs, and cells selected by FACS as described in Materials and Methods. Cell lines were serum starved for 2 h, stimulated with insulin (100 nM, 10 min) and samples analysed by immunoblotting.
How do other pathways talk to IRS-1? Functional Interactions that can modify IRS-1 by phosphorylation M. White Can J P Jul 06
Interrogating cAMP-dependent kinase signaling in Jurkat T-Cells by a protein kinase A targeted immune-precipitation phosphoproteomicsapproach P Giansanti, M P Stokes, J C Silva, A Scholtenand A J R Heck Molec & Cell Proteomics, Papers in Press. Published on July 23, 2013
Workflow for the targeted analysis of PKA substrates in Jurkat cells Figure 1. A, Western blots of Jurkat clone E6.1 cells stimulated with PGE2 (10 M) over a 60 min time course using the phospho-PKA substrate antibody (top) and a tubulin antibody (bottom) as control, supplemented by a densitometric analysis of the Western blots. B, Quantitative Proteomics. Jurkat cells were either left unstimulated (Control) or activated with PGE2 (10 M) over two different stimulation times (1 min and 60 min). After lysis and enzymatic digestion with Lys-C, peptides were differentially labeled with three stable isotope dimethyl-labels and subsequently combined. Next, an immunoprecipitation with the immobilized phospho- PKA substrate specific antibody was performed. After stringent washing, the eluate was analyzed by nanoLC-MS. Peptides and proteins were identified by database search, and a functional analysis was performed using motif search algorithms as well as Ingenuity and String Molec & Cell Proteomics, July 23, 2013
Interaction map for PGE2 downstream substrates Fig 6. Proteinprotein interactions were derived from both the STRING database using experimental evidence and “high confidence” interactions (score > 0.700) while the substrate lines derived from the search function in the PhosphoSitePlus database. The interaction map was generated using Cytoscape. Protein class information is from PhosphoSitePlus. Color coding indicates sensitivity to PGE2 stimulation. Molec & Cell Proteomics, July 23, 2013
Proteins not yet implicated in PKA signaling Molec & Cell Proteomics, Papers in Press. Published on July 23, 2013
Currently Recognized Mechanism(s) for regulation of steroidsynthesis PDEs ? AC Gs Gi PKA Hormone (LH, ACTH etc.) HSL/CEH cAMP P AMP P P PAT PAT P P Cholesterol Storage Droplet HSL/CEH Chol Storage Droplet P P P P PKA Pregnenolone Q: What PDEs regulate which processes in this steroid producing cell type?? 3bHSD Progesterone P450c17 Androstenedione 17bHSD TESTOSTERONE Corticosterone
Viagra cGS Ca2+/CaM cGI PDE “Superfamily” • 11 families, 21 genes, 100+ variants/isoforms cAMP hydrolysing PDE6s cGMP hydrolysing PDE5 cGMP and cAMP- hydrolyzing PDE11 PDE2 PDE9 PDE10 PDE8s PDE7s PDE1s PDE4s PDE3s
PDE mRNA profiles in enriched Leydig cell preparation and MA10 cells. In order to determine which PDEs are expressed in Leydig cells, mRNA levels are analyzed by real-time PCR reactions in Leydig cell preparation obtained from WT testis and MA10 cells. Total RNA from the cells was isolated using a NucleoSpin RNA II kit according to the manufacture’s protocol (Macherey Nagel Inc., Bethlehem, PA). Then cDNA samples were generated with SuperScript III reverse transcriptase (Invitrogen) using 1 μg of total RNA for each reaction. Relative gene expression was determined by performing real- time PCR on a MX3000P QPCR system (Stratagene/Agilent Technologies, Santa Clara, CA) and analyzed with Mx-Pro® software. The sequences of primers for PDEs are shown below and some have been previously reported and verified (Patrucco et al., 2010). RT-PCR reactions were run with iTaq SYBR supermix (Biorad) with the following thermal profile: denaturing at 95°C for 15 sec, annealing at 55°C for 1 min, extension at 72°C for 1 min, for 40 cycles. The levels of PDE mRNAs are shown as a relative amount to β-actin. Shimizu-Albergine et al, MolPharmacol 81:556–566, 2012
-Galactosidase expression for PDE8A and PDE8B KOs in the interstitial area of the testes PDE8B KO PDE8A KO WT 6 7 8 9 10 11 12 13 14 15 16 17 18 19 20 21 22 2 3 4 5 1 LAC-Z NEO
Effect of PDE8 inhibitor on forskolin dose response curve PF-4957325 + IBMX IBMX 30 uM Progesterone (ng / mg prot) - PF-4957325 100 nM vehicle Forskolin (µM) NOTE; IBMX most effective in presence of PDE8 inhibitor or high forskolin
Co-inhibition of PDE8 and PDE4 increases progesterone in MA10 cells REQUIRED FOR 150 None 150 IBMX (50 uM) Rolipram (10 uM) 100 100 Control Progesterone (ng/mg) Progesterone (ng/mg) +Rol 50 +PF-04957325 +Rol +PF(200 nM) 50 0 40 30 0 1000 100 10 20 PF – 04957325 (nM) 10 0
Are there other, unknown, synergistic mechanisms/pathways? Unbiased approach: Phosphoproteomics Martin Golkowski Shao-En Ong
SILAC Procedure (Stable Isotope Labeling with Amino acids in Cell culture) Cells are stimulated with factors of interest (eg. PDE inhibitors) for various times 2. Cells are lysed and enzymatically digested. 3. Peptides are separated using ion exchange chromatography. 4. Phosphopeptides are enriched using phospho-specific antibodies, or immobilized metal affinity chromatography. 5. Phosphopeptides are analyzed using mass spectrometry.
Protocol • MA10 cells labeled with Heavy, Medium, or Light Isotopes are treated 1 hour with PDE inhibitors (control, PDE4i, PDE8i, or both) Results • ~ 8000 phospho-peptides identified • ~ 320 increased >2 fold by combination of PDE8 and PDE4 inhibitors • Very few increased by individual PDE inhibitors alone • Over 30 with good consensus PKA sites ( >3x ) • Several suggest new points for cAMP/PDE regulation of steroidogenic function • Several suggest other previously unappreciated cAMP regulated functions
PKA consensus site phosphorylation: +/- PDE4/8 inhibitors Wnk1 (6x), Nav1 (6x), Tbc1d25(5x), Ethe1 (5x), Sqstm1 (5x), Arhgef2 (4x), Arfgap1 (4x), Cgnl1 (3x), Ralgapa1 (3x), Nckap5 (3x), Ripk2 (3x), Slc24A3 (3x), Casp8 (3x), PDE8A&B (2.5x)
8Br-cAMP 300µM PF 200nM Rol10µM PF+Rol Control Increased phosphorylation of Raf-1 and HSL by combined PDE4/8 inhibition in MA10 cells p-Raf-1 (Ser43) Raf-1 p-HSL (Ser660) HSL GAPDH MA10 cells were treated with the inhibitors or 8Br-cAMP for 60 min
cAMP/PKA regulates Leydig cell steroidogenesis P LHR tmAC EGF-R P PDE8B Ras cAMP P PDE4 P Raf PKA MEK AMPK P ERK P CREB P P HSL Nur77 P Chol P StAR P StAR Lipid Droplet PDE8A p450 p450 P Pregnenolone Perilipin-1 Progesterone