Download

1 / 54
540 likes | 543 Vues
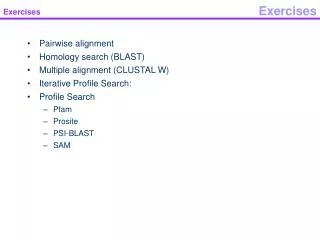
This exercise lists the variables that contribute to zone broadening in chromatography, including multiple paths (eddy diffusion), longitudinal diffusion, and the mass transfer term. It also explores the minimum in a plot of plate height versus mobile phase velocity in LC and GC, and explains the impact of diffusion coefficients on separation efficiency.

E N D
Exercise 4.1 x) List the variables that lead to zone broadening in chromatography
Exercise 4.1 x) List the variables that lead to zone broadening in chromatography Multiple paths, A, (”eddy diffusion”) The van Deemter equation for plate height, H:
Exercise 4.1 x) List the variables that lead to zone broadening in chromatography Multiple paths, A, (”eddy diffusion”) Longitudinal diffusion, B The van Deemter equation for plate height, H:
Exercise 4.1 x) List the variables that lead to zone broadening in chromatography Multiple paths, A, (”eddy diffusion”) Longitudinal diffusion, B The mass transfer term (in mobile phase, CM, and stationary phase, CS) The van Deemter equation for plate height, H:
Exercise 4.1 x) List the variables that lead to zone broadening in chromatography Multiple paths, A, (”eddy diffusion”) Longitudinal diffusion, B The mass transfer term (in mobile phase, CM, and stationary phase, CS) +++ Extra column effects The van Deemter equation for plate height, H:
Exercise 4.2 x) Why does the minimum in a plot of plate height versus mobile phase velocity occur at lower velocity in LC than in GC?
Exercise 4.2 x) Why does the minimum in a plot of plate height versus mobile phase velocity occur at lower velocity in LC than in GC? The van Deemter equation for plate height, H:
11 1 + 6k + k r 2 2 C = M 24( + 1) k D 2 M Exercise 4.2 x) Why does the minimum in a plot of plate height versus mobile phase velocity occur at lower velocity in LC than in GC? The van Deemter equation for plate height, H: Mass transfer in the mobile phase: r is the column radius k is the retention factor DM is the diffusion coefficient in the mobile phase B is i direct function of the diffusion coefficient of the analyte in the mobile phase, DM: B = 2·DM
11 1 + 6k + k r 2 2 C = M 24( + 1) k D 2 M Exercise 4.2 x) Why does the minimum in a plot of plate height versus mobile phase velocity occur at lower velocity in LC than in GC? The van Deemter equation for plate height, H: Mass transfer in the mobile phase: r is the column radius k is the retention factor DM is the diffusion coefficient in the mobile phase B is i direct function of the diffusion coefficient of the analyte in the mobile phase, DM: B = 2·DM B DM CM 1/DM
11 1 + 6k + k r 2 2 C = M 24( + 1) k D 2 M Exercise 4.2 x) Why does the minimum in a plot of plate height versus mobile phase velocity occur at lower velocity in LC than in GC? The van Deemter equation for plate height, H: Mass transfer in the mobile phase: r is the column radius k is the retention factor DM is the diffusion coefficient in the mobile phase B is i direct function of the diffusion coefficient of the analyte in the mobile phase, DM: B = 2·DM Both the B-term and the C-terms are functions of the diffusion coefficients in the mobile phase. Diffusion in gases is much higher than diffusion in liquids. lower diffusion in liquids gives lower B and higher C, which will shift the minimum in the curve to lower mobile phase velocities.
Exercise 4.2 x) Why does the minimum in a plot of plate height versus mobile phase velocity occur at lower velocity in LC than in GC? A=1, B=1, C=1 uopt = √B/C = 1 A=1, B=0.5, C=2 uopt = √B/C = 0.5 Both the B-term and the C-terms are functions of the diffusion coefficients in the mobile phase. Diffusion in gases is much higher than diffusion in liquids. lower diffusion in liquids gives lower B and higher C, which will shift the minimum in the curve to lower mobile phase velocities.
Exercise 4.3 The two chromatograms show a group of solvents separated by GC on two capillary columns with different stationary phase thickness: 0.25 μm and 1.0 μm (left and right plot respectively). Both columns are 15 m long, have internal diameter of 0.32 mm and are coated with the same stationary phase. Temperature and carrier gas settings were also identical. Helium was used as carrier gas in both cases with a linear velocity of 38 cm/s and the oven temperature was 40C. According to the van Deemter equation and the relationship CSdf one should expect that the column with 0.25 μm phase has higher separation efficiency than the column with 1.0 μm phase. But the resolution is obviously much better on the chromatogram to the right. Explain why.
Exercise 4.3 The two chromatograms show a group of solvents separated by GC on two capillary columns with different stationary phase thickness: 0.25 μm and 1.0 μm (left and right plot respectively). Both columns are 15 m long, have internal diameter of 0.32 mm and are coated with the same stationary phase. Temperature and carrier gas settings were also identical. Helium was used as carrier gas in both cases with a linear velocity of 38 cm/s and the oven temperature was 40C. According to the van Deemter equation and the relationship CSdf one should expect that the column with 0.25 μm phase has higher separation efficiency than the column with 1.0 μm phase. But the resolution is obviously much better on the chromatogram to the right. Explain why.
N 4 α–1 α k(B) 1+k(B) Rs = Exercise 4.3 The two chromatograms show a group of solvents separated by GC on two capillary columns with different stationary phase thickness: 0.25 μm and 1.0 μm (left and right plot respectively). Both columns are 15 m long, have internal diameter of 0.32 mm and are coated with the same stationary phase. Temperature and carrier gas settings were also identical. Helium was used as carrier gas in both cases with a linear velocity of 38 cm/s and the oven temperature was 40C. According to the van Deemter equation and the relationship CSdf one should expect that the column with 0.25 μm phase has higher separation efficiency than the column with 1.0 μm phase. But the resolution is obviously much better on the chromatogram to the right. Explain why. The purnell equation
N 4 α–1 α k(B) 1+k(B) Rs = Exercise 4.3 The two chromatograms show a group of solvents separated by GC on two capillary columns with different stationary phase thickness: 0.25 μm and 1.0 μm (left and right plot respectively). Both columns are 15 m long, have internal diameter of 0.32 mm and are coated with the same stationary phase. Temperature and carrier gas settings were also identical. Helium was used as carrier gas in both cases with a linear velocity of 38 cm/s and the oven temperature was 40C. According to the van Deemter equation and the relationship CSdf one should expect that the column with 0.25 μm phase has higher separation efficiency than the column with 1.0 μm phase. But the resolution is obviously much better on the chromatogram to the right. Explain why. k is in this case very low, making the last factor in the Purnell equation significant
N 4 α–1 α k(B) 1+k(B) Rs = Exercise 4.3 The two chromatograms show a group of solvents separated by GC on two capillary columns with different stationary phase thickness: 0.25 μm and 1.0 μm (left and right plot respectively). Both columns are 15 m long, have internal diameter of 0.32 mm and are coated with the same stationary phase. Temperature and carrier gas settings were also identical. Helium was used as carrier gas in both cases with a linear velocity of 38 cm/s and the oven temperature was 40C. According to the van Deemter equation and the relationship CSdf one should expect that the column with 0.25 μm phase has higher separation efficiency than the column with 1.0 μm phase. But the resolution is obviously much better on the chromatogram to the right. Explain why. We can calculate k for tR around 2 min: tm = 1500 cm / 38 cm/s = 39 s = 0.66 min t′R = 2.00 min – 0.66 min = 1.34 min k = t′R / tM = 1.34 / 0.66 = 2.03 (for 1 um phase)
N 4 α–1 α k(B) 1+k(B) Rs = Exercise 4.3 The two chromatograms show a group of solvents separated by GC on two capillary columns with different stationary phase thickness: 0.25 μm and 1.0 μm (left and right plot respectively). Both columns are 15 m long, have internal diameter of 0.32 mm and are coated with the same stationary phase. Temperature and carrier gas settings were also identical. Helium was used as carrier gas in both cases with a linear velocity of 38 cm/s and the oven temperature was 40C. According to the van Deemter equation and the relationship CSdf one should expect that the column with 0.25 μm phase has higher separation efficiency than the column with 1.0 μm phase. But the resolution is obviously much better on the chromatogram to the right. Explain why. k = 2.03 (for 1 μm phase) All other factors kept constant, if the phase thickness is decreased to 25%, k decreases to 25% (because Kc is the same) k = 2.03 / 4 = 0.51 for (for 0.25 μm phase)
N 4 α–1 α k(B) 1+k(B) Rs = Exercise 4.3 The two chromatograms show a group of solvents separated by GC on two capillary columns with different stationary phase thickness: 0.25 μm and 1.0 μm (left and right plot respectively). Both columns are 15 m long, have internal diameter of 0.32 mm and are coated with the same stationary phase. Temperature and carrier gas settings were also identical. Helium was used as carrier gas in both cases with a linear velocity of 38 cm/s and the oven temperature was 40C. According to the van Deemter equation and the relationship CSdf one should expect that the column with 0.25 μm phase has higher separation efficiency than the column with 1.0 μm phase. But the resolution is obviously much better on the chromatogram to the right. Explain why. k = 2.03 (for 1 μm phase) 2.03 / (1+2.03) = 0.67 k = 2.03 / 4 = 0.51 for (for 0.25 μm phase) 0.51 / (1+0.51) = 0.34
N 4 α–1 α k(B) 1+k(B) Rs = Exercise 4.3 The two chromatograms show a group of solvents separated by GC on two capillary columns with different stationary phase thickness: 0.25 μm and 1.0 μm (left and right plot respectively). Both columns are 15 m long, have internal diameter of 0.32 mm and are coated with the same stationary phase. Temperature and carrier gas settings were also identical. Helium was used as carrier gas in both cases with a linear velocity of 38 cm/s and the oven temperature was 40C. According to the van Deemter equation and the relationship CSdf one should expect that the column with 0.25 μm phase has higher separation efficiency than the column with 1.0 μm phase. But the resolution is obviously much better on the chromatogram to the right. Explain why. What would be the most obvious choice for increasing the resolution with the column with 0.25 μm film?
N 4 α–1 α k(B) 1+k(B) Rs = Exercise 4.3 The two chromatograms show a group of solvents separated by GC on two capillary columns with different stationary phase thickness: 0.25 μm and 1.0 μm (left and right plot respectively). Both columns are 15 m long, have internal diameter of 0.32 mm and are coated with the same stationary phase. Temperature and carrier gas settings were also identical. Helium was used as carrier gas in both cases with a linear velocity of 38 cm/s and the oven temperature was 40C. According to the van Deemter equation and the relationship CSdf one should expect that the column with 0.25 μm phase has higher separation efficiency than the column with 1.0 μm phase. But the resolution is obviously much better on the chromatogram to the right. Explain why. What would be the most obvious choice for increasing the resolution with the column with 0.25 μm film? Decrease the temperature so that k increases to the level it is with the 1 μm film. (But the method would then take more time)
N 4 α–1 α k(B) 1+k(B) Rs = Exercise 4.3 The two chromatograms show a group of solvents separated by GC on two capillary columns with different stationary phase thickness: 0.25 μm and 1.0 μm (left and right plot respectively). Both columns are 15 m long, have internal diameter of 0.32 mm and are coated with the same stationary phase. Temperature and carrier gas settings were also identical. Helium was used as carrier gas in both cases with a linear velocity of 38 cm/s and the oven temperature was 40C. According to the van Deemter equation and the relationship CSdf one should expect that the column with 0.25 μm phase has higher separation efficiency than the column with 1.0 μm phase. But the resolution is obviously much better on the chromatogram to the right. Explain why. What would be the most obvious choice for increasing the resolution with the column with 0.25 μm film? Reducing the column length and keeping k at the same level would in this case be a better way to reduce retention time. Reducing the length to half would decrease retention times to half, but the resolution would only be decreased to approximately 71% (√0.5=0.71)
Exercise 4.4 Column length, L = 24.7 cm Rs = 0.72 (from exercise 3.3) C B 1.16 1.07 14.1 13.3
Exercise 4.4 Column length, L = 24.7 cm Rs = 0.72 (from exercise 3.3) None of the terms in the van Deemter equation are affected by change in column length, so plate height, H, is the same. C L N L H N L H = N = B 1.16 1.07 14.1 13.3
N 4 α–1 α k(B) 1+k(B) Rs = Exercise 4.4 Column length, L = 24.7 cm Rs = 0.72 (from exercise 3.3) None of the terms in the van Deemter equation are affected by change in column length, so plate height, H, is the same. C L N L H N L H = N = The Purnell equation says that Rs N (α and k is unaffected) B N L and Rs N Rs L 1.16 1.07 14.1 13.3
N 4 α–1 α k(B) 1+k(B) Rs = Exercise 4.4 Column length, L = 24.7 cm Rs = 0.72 (from exercise 3.3) None of the terms in the van Deemter equation are affected by change in column length, so plate height, H, is the same. C L N L H N L H = N = The Purnell equation says that Rs N (α and k is unaffected) B N L and Rs N Rs L L Rs2 1.16 1.07 14.1 13.3
N 4 α–1 α k(B) 1+k(B) Rs = Exercise 4.4 Column length, L = 24.7 cm Rs = 0.72 (from exercise 3.3) None of the terms in the van Deemter equation are affected by change in column length, so plate height, H, is the same. C L N L H N L H = N = The Purnell equation says that Rs N (α and k is unaffected) B N L and Rs N Rs L L Rs2 (L(new) / L(old)) = (Rs(new)/Rs(old))2 1.16 1.07 14.1 13.3
N 4 α–1 α k(B) 1+k(B) Rs = Exercise 4.4 Column length, L = 24.7 cm Rs = 0.72 (from exercise 3.3) None of the terms in the van Deemter equation are affected by change in column length, so plate height, H, is the same. C L N L H N L H = N = The Purnell equation says that Rs N (α and k is unaffected) B N L and Rs N Rs L L Rs2 (L(new) / L(old)) = (Rs(new)/Rs(old))2 L(new) = (Rs(new)/Rs(old))2 · L(old) 1.16 1.07 14.1 13.3
N 4 α–1 α k(B) 1+k(B) Rs = Exercise 4.4 Column length, L = 24.7 cm Rs = 0.72 (from exercise 3.3) None of the terms in the van Deemter equation are affected by change in column length, so plate height, H, is the same. C L N L H N L H = N = The Purnell equation says that Rs N (α and k is unaffected) B N L and Rs N Rs L L Rs2 (L(new) / L(old)) = (Rs(new)/Rs(old))2 L(new) = (Rs(new)/Rs(old))2 · L(old) = (1.5 / 0.72)2 · 24.7 cm = 107 cm 1.16 1.07 14.1 13.3
Exercise 4.4 tR=5.4 min wb=0.41 min tR=14.1 min wb=1.16 min tR=21.6 min wb=1.72 min tR=13.3 min wb=1.07 min 0 2 4 6 8 10 12 14 16 18 20 22 min
Exercise 4.4 Both tM and t’R will increase proportionally with the column length tR increase proportionally with the column length tR=5.4 min wb=0.41 min tR=14.1 min wb=1.16 min tR=21.6 min wb=1.72 min tR=13.3 min wb=1.07 min 0 2 4 6 8 10 12 14 16 18 20 22 min
Exercise 4.4 Both tM and t’R will increase proportionally with the column length tR increase proportionally with the column length tR(old) = 21.6 min tR(new) = tR(old)· L(new) / L(old) tR(new) = 21.6 min · (107 / 24.7) = 93.8 min tR=5.4 min wb=0.41 min tR=14.1 min wb=1.16 min tR=21.6 min wb=1.72 min tR=13.3 min wb=1.07 min 0 2 4 6 8 10 12 14 16 18 20 22 min
Exercise 4.5 The optimal mobile phase velocity is found where A + B/u + C∙u has a local minimum, meaning that the derivative is 0. uopt = √B/C = 0.0014 / 0.0031 = 0.67 mm/s
Exercise 4.5 The optimal mobile phase velocity is found where A + B/u + C∙u has a local minimum, meaning that the derivative is 0. uopt = √B/C = 0.0014 / 0.0031 = 0.67 mm/s Note the difference to GC where optimal velocities are typically around 20-35 cm/s
Exercise 4.5 0.020 B u H = A + + C∙u 0.018 0.016 0.0014 u 0.014 H = 0.0074 + + 0.0031∙u H (mm) 0.012 0.010 0.008 0.006 0.004 0.002 0.000 0.0 0.2 0.4 0.6 0.8 1.0 1.2 1.4 1.6 1.8 2.0 2.2 2.4 2.6 2.8 3.0 Velocity, u (mm/s)
Exercise 4.5 0.020 B u H = A + + C∙u 0.018 0.016 0.0014 u 0.014 H = 0.0074 + + 0.0031∙u H (mm) 0.012 0.010 0.008 0.006 0.004 0.002 0.000 0.0 0.2 0.4 0.6 0.8 1.0 1.2 1.4 1.6 1.8 2.0 2.2 2.4 2.6 2.8 3.0 Velocity, u (mm/s)
Exercise 4.5 0.020 B u H = A + + C∙u 0.018 0.016 0.0014 u 0.014 H = 0.0074 + + 0.0031∙u H (mm) 0.012 0.010 0.008 0.006 0.004 0.002 0.000 0.0 0.2 0.4 0.6 0.8 1.0 1.2 1.4 1.6 1.8 2.0 2.2 2.4 2.6 2.8 3.0 Velocity, u (mm/s)
Exercise 4.5 0.020 B u H = A + + C∙u 0.018 0.016 0.0014 u 0.014 H = 0.0074 + + 0.0031∙u H (mm) 0.012 0.010 0.008 0.006 0.004 0.002 0.000 0.0 0.2 0.4 0.6 0.8 1.0 1.2 1.4 1.6 1.8 2.0 2.2 2.4 2.6 2.8 3.0 Velocity, u (mm/s)
Exercise 4.5 0.020 B u H = A + + C∙u 0.018 0.016 0.0014 u 0.014 H = 0.0074 + + 0.0031∙u H (mm) 0.012 0.010 0.008 0.006 0.004 0.002 0.000 0.0 0.2 0.4 0.6 0.8 1.0 1.2 1.4 1.6 1.8 2.0 2.2 2.4 2.6 2.8 3.0 Velocity, u (mm/s)
Exercise 4.5 0.020 B u uopt H = A + + C∙u 0.018 0.016 0.0014 u 0.014 H = 0.0074 + + 0.0031∙u H (mm) 0.012 0.010 0.008 0.006 0.004 0.002 0.000 0.0 0.2 0.4 0.6 0.8 1.0 1.2 1.4 1.6 1.8 2.0 2.2 2.4 2.6 2.8 3.0 Velocity, u (mm/s)
Exercise 4.5 A term: Eq (14) CM term in packed columns Eq (16) Needed for 4.5d A(new) = A(old)· (dp(new) / dp(old)) = 0.0074 · 3/5 = 0.0044 mm C(new) = C(old)· (dp(new) / dp(old))2 = 0.0031 · (3/5)2 = 0.0011 mm uopt = B/C = 0.0014 / 0.0011 = 1.1 mm/s
Exercise 4.5 0.020 B u uopt H = A + + C∙u 0.018 0.016 0.0014 u 0.014 H = 0.0044 + + 0.0011∙u H (mm) 0.012 0.010 0.008 0.006 0.004 0.002 0.000 0.0 0.2 0.4 0.6 0.8 1.0 1.2 1.4 1.6 1.8 2.0 2.2 2.4 2.6 2.8 3.0 Velocity, u (mm/s)
0.020 0.018 0.016 5 μm 0.014 0.012 0.010 0.008 3 μm 0.006 0.004 0.002 0.000 0.0 0.2 0.4 0.6 0.8 1.0 1.2 1.4 1.6 1.8 2.0 2.2 2.4 2.6 2.8 3.0 Exercise 4.5 H (mm) Velocity, u (mm/s)
Exercise 4.6 tR=4.11 min wb=1.95 min tR=13.30 min wb=2.05 min tR=22.21 min wb=2.10 min tR=7.51 min wb=2.03 min 0 2 4 6 8 10 12 14 16 18 20 22 24
Eq (8) Exercise 4.6 N = 71 N = 219 N = 673 N = 1790 tR=4.11 min wb=1.95 min tR=13.30 min wb=2.05 min tR=22.21 min wb=2.10 min tR=7.51 min wb=2.03 min 0 2 4 6 8 10 12 14 16 18 20 22 24
tR=4.11 min wb=1.95 min tR=13.30 min wb=2.05 min tR=22.21 min wb=2.10 min tR=7.51 min wb=2.03 min 0 2 4 6 8 10 12 14 16 18 20 22 24 Exercise 4.6 N = 71 N = 219 N = 673 N = 1790 The peak widths are almost identical. Normally they would increase with retention under isocratic conditions if the peak broadening were caused by the column and could be explained by the van Deemter equation.
tR=4.11 min wb=1.95 min tR=13.30 min wb=2.05 min tR=22.21 min wb=2.10 min tR=7.51 min wb=2.03 min 0 2 4 6 8 10 12 14 16 18 20 22 24 Exercise 4.6 N = 71 N = 219 N = 673 N = 1790 The peak widths are almost identical. Normally they would increase with retention under isocratic conditions if the peak broadening were caused by the column and could be explained by the van Deemter equation.
tR=4.11 min wb=1.95 min tR=13.30 min wb=2.05 min tR=22.21 min wb=2.10 min tR=7.51 min wb=2.03 min 0 2 4 6 8 10 12 14 16 18 20 22 24 Exercise 4.6 N = 71 N = 219 N = 673 N = 1790 The peak widths are almost identical. Normally they would increase with retention under isocratic conditions if the peak broadening were caused by the column and could be explained by the van Deemter equation. The contrubution from extra-column effects are independent of retention time.