Download
1 / 1
10 likes | 132 Vues
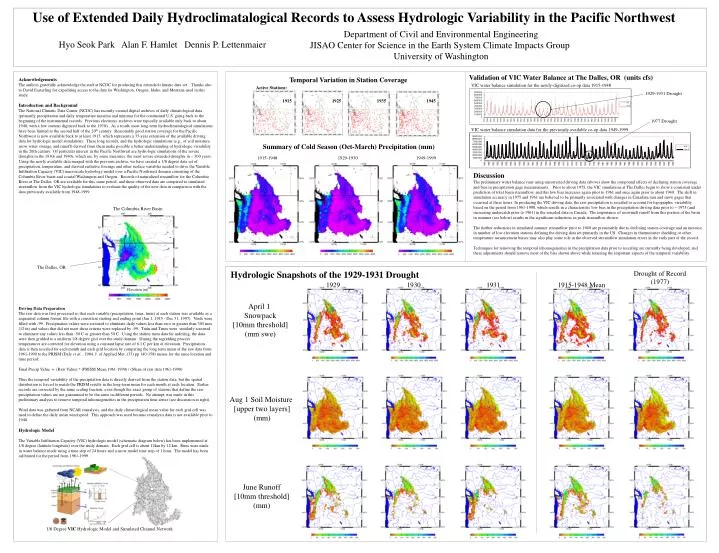
1/8 Degree VIC Hydrologic Model and Simulated Channel Network. Use of Extended Daily Hydroclimatalogical Records to Assess Hydrologic Variability in the Pacific Northwest. Department of Civil and Environmental Engineering JISAO Center for Science in the Earth System Climate Impacts Group

E N D
1/8 Degree VIC Hydrologic Model and Simulated Channel Network Use of Extended Daily Hydroclimatalogical Records to Assess Hydrologic Variability in the Pacific Northwest Department of Civil and Environmental Engineering JISAO Center for Science in the Earth System Climate Impacts Group University of Washington Hyo Seok Park Alan F. Hamlet Dennis P. Lettenmaier Validation of VIC Water Balance at The Dalles, OR (units cfs) Temporal Variation in Station Coverage Acknowledgements The authors gratefully acknowledge the staff at NCDC for producing this extended climatic data set. Thanks also to David Easterling for expediting access to the data for Washington, Oregon, Idaho, and Montana used in this study. Introduction and Background The National Climatic Data Center (NCDC) has recently created digital archives of daily climatological data (primarily precipitation and daily temperature maxima and minima) for the continental U.S. going back to the beginning of the instrumental records. Previous electronic archives were typically available only back to about 1948, with a few stations digitized back to the 1930's. As a result, most long-term hydroclimatalogical simulations have been limited to the second half of the 20th century. Reasonably good station coverage for the Pacific Northwest is now available back to at least 1915, which represents a 35-year extension of the available driving data for hydrologic model simulations. These long records, and the hydrologic simulations (e.g., of soil moisture, snow water storage, and runoff) derived from them make possible a better understanding of hydrologic variability in the 20th century. Of particular interest in the Pacific Northwest are hydrologic simulations of the severe droughts in the 1930s and 1940s, which are, by some measures, the most severe extended droughts in ~ 300 years. Using the newly available data merged with the previous archive, we have created a 1/8 degree data set of precipitation, temperature, and derived radiative forcings and other surface variables needed to drive the Variable Infiltration Capacity (VIC) macroscale hydrology model over a Pacific Northwest domain consisting of the Columbia River basin and coastal Washington and Oregon. Records of naturalized streamflow for the Columbia River at The Dalles, OR are available for this same period, and these observed data are compared to simulated streamflow from the VIC hydrologic simulations to evaluate the quality of the new data in comparison with the data previously available from 1948-1999. Driving Data Preparation The raw data was first processed so that each variable (precipitation, tmax, tmin) at each station was available as a sequential column format file with a consistent starting and ending point (Jan 1, 1915 - Dec 31, 1997). Voids were filled with -99. Precipitation values were screened to eliminate daily values less than zero or greater than 305 mm (12 in) and values that did not meet these criteria were replaced by -99. Tmin and Tmax were similarly screened to eliminate any values less than -50 C or greater than 50 C. Using the station meta data for indexing, the data were then gridded to a uniform 1/8 degree grid over the study domain. During the regridding process temperatures are corrected for elevation using a constant lapse rate of 6.1 C per km of elevation. Precipitation data is then rescaled for each month and each grid location by comparing the long term mean of the raw data from 1961-1990 to the PRISM (Daly et al. , 1984, J. of Applied Met. (33) pp 140-158) means for the same location and time period: Final Precip Value = (Raw Value) * (PRISM Mean 1961-1990) / (Mean of raw data 1961-1990) Thus the temporal variability of the precipitation data is directly derived from the station data, but the spatial distribution is forced to match the PRISM results in the long-term mean for each month at each location. Earlier records are corrected by the same scaling fraction, even though the exact group of stations that define the raw precipitation values are not guaranteed to be the same in different periods. No attempt was made in this preliminary analysis to remove temporal inhomogeneities in the precipitation time series (see discussion at right). Wind data was gathered from NCAR reanalysis, and the daily climatological mean value for each grid cell was used to define the daily mean wind speed. This approach was used because reanalysis data is not available prior to 1948. Hydrologic Model The Variable Infiltration Capacity (VIC) hydrologic model (schematic diagram below) has been implemented at 1/8 degree (latitude longitude) over the study domain. Each grid cell is about 12km by 12 km. Runs were made in water balance mode using a time step of 24 hours and a snow model time step of 1 hour. The model has been calibrated for the period from 1961-1999. VIC water balance simulation for the newly-digitized co-op data 1915-1948 Active Stations: 1929-1931 Drought 1915 1925 1935 1945 1977 Drought VIC water balance simulation data for the previously available co-op data 1949-1999 Summary of Cold Season (Oct-March) Precipitation (mm) 1915-1948 1929-1930 1949-1999 Discussion The preliminary water balance runs using uncorrected driving data (above) show the compound effects of declining station coverage and bias in precipitation gage measurements. Prior to about 1975, the VIC simulations at The Dalles begin to show a consistent under prediction of total basin streamflow, and this low bias increases again prior to 1961 and once again prior to about 1940. The shift in simulation accuracy in 1975 and 1961 are believed to be primarily associated with changes in Canadian rain and snow gages that occurred at these times. In producing the VIC driving data, the raw precipitation is rescaled to account for topographic variability based on the period from 1961-1990, which results in a characteristic low bias in the precipitation driving data prior to ~ 1975 (and increasing undercatch prior to 1961) in the rescaled data in Canada. The importance of snowmelt runoff from this portion of the basin in summer (see below) results in the significant reductions in peak streamflow shown. The further reductions in simulated summer streamflow prior to 1940 are presumably due to declining station coverage and an increase in number of low elevation stations defining the driving data set primarily in the US. Changes in thermometer shielding or other temperature measurement biases may also play some role in the observed streamflow simulation errors in the early part of the record. Techniques for removing the temporal inhomogeneities in the precipitation data prior to rescaling are currently being developed, and these adjustments should remove most of the bias shown above while retaining the important aspects of the temporal variability. The Columbia River Basin The Dalles, OR Hydrologic Snapshots of the 1929-1931 Drought Drought of Record (1977) 1929 1930 1931 1915-1948 Mean Elevation (m) April 1 Snowpack [10mm threshold] (mm swe) Aug 1 Soil Moisture [upper two layers] (mm) June Runoff [10mm threshold] (mm)