Download
1 / 48
480 likes | 726 Vues
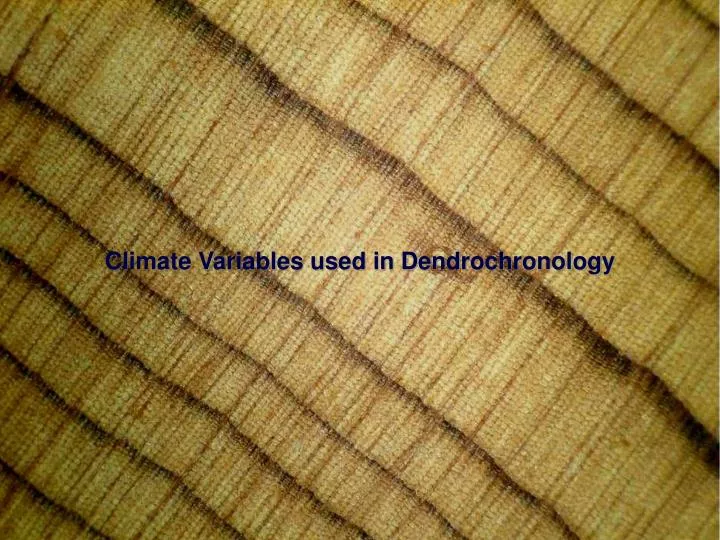
Climate Variables used in Dendrochronology. Tree-ring data are just one type of many proxies of past climate. Tree-ring data are extremely valuable for evaluating past changes in temperature, for example. Why is past information needed?.

E N D
Tree-ring data are just one type of many proxies of past climate.
Tree-ring data are extremely valuable for evaluating past changes in temperature, for example. Why is past information needed? To better understand trends in future climate, whether human-forced or natural.
Trends in reconstructed precipitation for the American Southwest.
Recent research emphasizes relationships between trends in tree-ring data and long-term climate oscillations.
Which climate variables can we analyze from the tree-ring record? • Precipitation: • Monthly • Seasonal • Water Year • Temperature: • Monthly • Seasonal
Palmer Drought Severity Index (PDSI) • Monthly • Seasonal • Palmer Hydrological Drought Index (PHDI) • Monthly • Seasonal • Where do these data come from? • National Climatic Data Center • FTP site for monthly divisional data:ftp://ftp.ncdc.noaa.gov/pub/data/cirs/
Climate Data Row Header: • Example: 0101011895 • 0101011895 State code Division number Climate Type Year Climate Data Types: 01 = Precipitation 07 = Z-Index 75 = SP0902 = Temperature 08 = PMDI 76 = SP1203 = Heating Degree Days 71 = SP01 77 = SP2404 = Cooling Degree Days 72 = SP0205 = PDSI 73 = SP0306 = PHDI 74 = SP06
El Niño-Southern Oscillation • Changes in pressure patterns, wind patterns, and oceanic circulation • Mainly concentrated in the Pacific Ocean • Measured using Southern Oscillation Index • Differences in pressure observed in Tahiti and Darwin, Australia • SOI = 10 x ((average Tahiti MSLP for month) - (average Darwin MSLP for month) - long term average difference for month) / long term standard deviation of difference for month) • Combined to form ENSO phenomenon • Brings drastic changes in weather to affected areas
Different El Niño-Southern Oscillation Indices based on region of the Pacific Ocean: • The Niño 3 Region is bounded by 90°W-150°W and 5°S- 5°N. The Niño 3.4 Region is bounded by 120°W-170°W and 5°S- 5°N.
What changes in climate can be expected? Much colder temps now in eastern Pacific. Warm ocean temps where they should be.
The NINO 3.4 Index is “the departure in monthly sea surface temperature from its long-term mean averaged over the NINO 3.4 region.” • In this method, an El Niño or La Niña event is identified if the 5-month running-average of the NINO 3.4 Index exceeds +0.4 °C (for El Niño; -0.4 °C for La Niña) for at least 6 consecutive months.
Pacific Decadal Oscillation • Discovered late 1990s by salmon fisheries experts • Long-lived El Niño-like pattern of Pacific climate variability • Operates on longer 20 to 30 year periods • Note when regime shifts occurred…
Pacific Decadal Oscillation Warm phase PDO
Pacific Decadal Oscillation Cool phase PDO
Climate during positive (warm) PDO phase: Mantua, N.J. 1999. The Pacific Decadal Oscillation and climate forecasting for North America. In Maryam Golnaraghi (ed), Climate Risk Solutions 1(1): 10-13. http://www.atmos.washington.edu/~mantua/REPORTS/PDO/PDO_cs.htm
Climate during positive (warm) PDO phase • Mechanisms: • Warm ocean waters in the eastern Pacific. • These give rise to development of low pressure troughs. • Jet stream allowed to track further south. • Brings moisture to southern tier of U.S., especially southwestern U.S. • Causes dry, warm (drought) conditions in northwestern U.S. • Note “polar” relationship between the two western regions. • Fire weather enhanced in northwestern U.S. during +PDO phase (“fires tended to occur during El Niño and positive PDO years.”) • Wet, mild weather in southwest = rapid growth of fuels • La Niña phase causes drying of fuels = fire weather in southwest.
Although the PDO exhibits several patterns of behavior, the most significant one seems to be in regime shifts between "warm" and "cool" patterns which last 20 to 30 years. • 1750: PDO displays an unusually strong oscillation. • 1905: After a strong swing, PDO changed to a weak warm phase. • 1925: Warm phase significantly strengthens. • 1946: PDO changed to a cool phase. • 1977: PDO changed to a warm phase. • 1998: PDO index showed several years of cool values, but did not remain in that pattern. • 2008: The early stages of a cool phase of the PDO?? • Current: PDO appears to be transitioning! • During the 1900s, PDO regime shifts were related to many different environmental changes in the Pacific Ocean.
Pacific Decadal Oscillation PDO reconstructed from tree-ring data.
Pacific Decadal Oscillation PDO reconstructed from tree-ring data.
Pacific Decadal Oscillation PDO-SOI reconstructed from tree-ring data.
“We also observed that CPYs became more numerous during the 20th century (beginning with the severe drought year of 1924) after a long absence of severe regional drought years between 1717 and 1923. This relationship possibly suggests that the influence of the PDO was nonexistent or minimal during the period 1717–1923, ” – Paul Knapp, Henri Grissino-Mayer, and Peter Soule, 2002, Quaternary Research.
North Atlantic Oscillation • Large scale seesaw in atmospheric mass between the subtropical high and the polar low • Dominant mode of winter climate variability in the North Atlantic region ranging from central North America to Europe • Again, note where shifts occurred…
North Atlantic Oscillation: Positive Phase Strong Atlantic pressure gradient
North Atlantic Oscillation: Negative Phase Weak Atlantic Pressure Gradient
North Atlantic Oscillation • Positive Phase: • More frequent and stronger winter storms crossing Atlantic on a more northerly track • Results in warm and wet winters in Europe and in cold and dry winters in northern Canada and Greenland • Eastern US experiences mild and wet winter conditions • Negative Phase: • Fewer and weaker storms on a more southerly track • Brings moist air into the Mediterranean and cold air to northern Europe • Eastern US experiences more cold air outbreaks and snowy weather conditions
E. Cook, R. D’Arrigo, and M. Mann, 2002. A well-verified, multiproxy reconstruction of the winter North Atlantic Oscillation Index since A.D. 1400. Journal of Climate 15: 1754-1764.
Figure 2. Correlation coefficients between the shortleaf pine standard chronology and precipitation, temperature, and PDSI (* p < 0.05, ** p < 0.01, *** p < 0.001).
Figure 7. Correlation coefficients between the shortleaf pine standard chronology and PDO, NAO, and SSTA (* p < 0.05, ** p < 0.01, *** p < 0.001).
Atlantic Multidecadal Oscillation • A multidecadal (20-40 yrs) pattern of North Atlantic sea surface temperature variability between the equator and Greenland. • When the AMO is positive (warm Atlantic), rainfall is lower than average over most of the United States. • During warm phases of the AMO, the number of tropical storms that mature into severe hurricanes is much greater than during cool phases. • Since the mid-1990s, we have been in a warm phase. • Appears related to the past occurrence of major droughts in the Midwest and the Southwest. Positive AMO = more frequent and severe droughts, and vice-versa. • Two of the most severe droughts of the 20th century occurred during the positive AMO between 1925 and 1965: The Dust Bowl of the 1930s and the 1950s drought.
Atlantic Multidecadal Oscillation • Rainfall in central and south Florida becomes more plentiful during a warm phase AMO, and droughts and wildfires are more frequent in the cool phase.
Atlantic Multidecadal Oscillation • 52% of drought variability in the lower U.S. can be attributed to the AMO and PDO! (Blue = wet, red = drought) + PDO + AMO + PDO - AMO (Drought frequency in percent of years.) - PDO + AMO - PDO - AMO
Atlantic Multidecadal Oscillation Accumulated Cyclone Energy by Year
Atlantic Multidecadal Oscillation AMO reconstructed from tree-ring data.
One final note on oscillations: • “Some feature of the atmosphere can always be found that will oscillate in accordance with your hypothesis.” • “Shortly after its discovery the oscillation will disappear.” • Peter B. Wright, 1971. Quasi-biennial oscillations in the atmosphere. Weather 26:69–76. • In 2007, Grissino-Mayer et al. discover “NAFO.”