Download
1 / 1
10 likes | 74 Vues
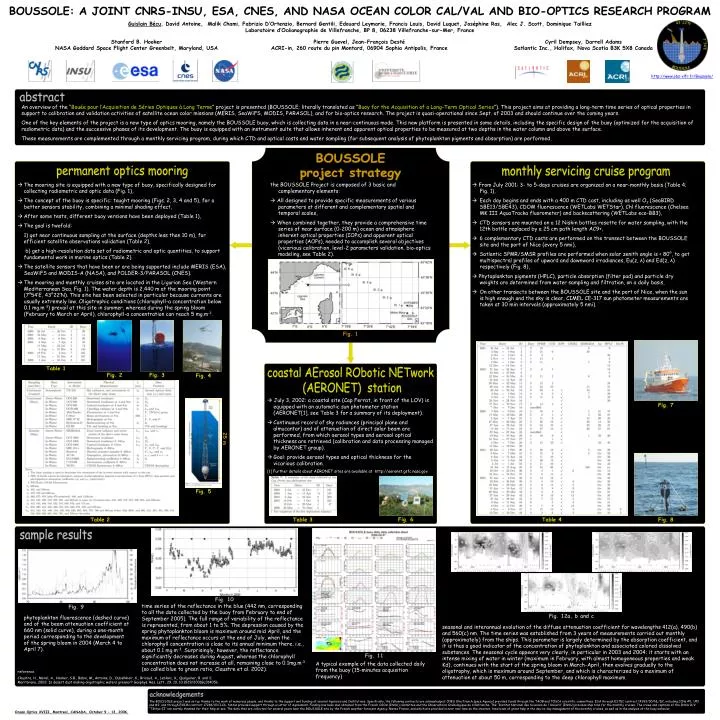
BOUSSOLE: A JOINT CNRS-INSU, ESA, CNES, AND NASA OCEAN COLOR CAL/VAL AND BIO-OPTICS RESEARCH PROGRAM Guislain Bécu , David Antoine, Malik Chami, Fabrizio D’Ortenzio, Bernard Gentili, Edouard Leymarie, Francis Louis, David Luquet, Joséphine Ras, Alec J. Scott, Dominique Tailliez

E N D
BOUSSOLE: A JOINT CNRS-INSU, ESA, CNES, AND NASA OCEAN COLOR CAL/VAL AND BIO-OPTICS RESEARCH PROGRAM Guislain Bécu, David Antoine, Malik Chami, Fabrizio D’Ortenzio, Bernard Gentili, Edouard Leymarie, Francis Louis, David Luquet, Joséphine Ras, Alec J. Scott, Dominique Tailliez Laboratoire d’Océanographie de Villefranche, BP 8, 06238 Villefranche-sur-Mer, France Stanford B. Hooker NASA Goddard Space Flight Center Greenbelt, Maryland, USA Pierre Guevel, Jean-François Desté ACRI-in, 260 route du pin Montard, 06904 Sophia Antipolis, France Cyril Dempsey, Darrell Adams Satlantic Inc., Halifax, Nova Scotia B3K 5X8 Canada http://www.obs-vlfr.fr/Boussole/ abstract An overview of the “Bouée pour l’Acquisition de Séries Optiques à Long Terme” project is presented (BOUSSOLE; literally translated as “Buoy for the Acquisition of a Long-Term Optical Series”). This project aims at providing a long-term time series of optical properties in support to calibration and validation activities of satellite ocean color missions (MERIS, SeaWiFS, MODIS, PARASOL), and for bio-optics research. The project is quasi-operational since Sept. of 2003 and should continue over the coming years. One of the key elements of the project is a new type of optics mooring, namely the BOUSSOLE buoy, which is collecting data in a near-continuous mode. This new platform is presented in some details, including the specific design of the buoy (optimized for the acquisition of radiometric data) and the successive phases of its development. The buoy is equipped with an instrument suite that allows inherent and apparent optical properties to be measured at two depths in the water column and above the surface. These measurements are complemented through a monthly servicing program, during which CTD and optical casts and water sampling (for subsequent analysis of phytoplankton pigments and absorption) are performed. BOUSSOLE project strategy monthly servicing cruise program permanent optics mooring The mooring site is equipped with a new type of buoy, specifically designed for collecting radiometric and optic data (Fig. 1), The concept of the buoy is specific: taught mooring (Figs. 2, 3, 4 and 5), for a better sensors stability, combining a minimal shading effect, After some tests, different buoy versions have been deployed (Table 1), The goal is twofold: 1) get near continuous sampling at the surface (depths less than 10 m), for efficient satellite observations validation (Table 2), b) get a high-resolution data set of radiometric and optic quantities, to support fundamental work in marine optics (Table 2). The satellite sensors that have been or are being supported include MERIS (ESA), SeaWiFS and MODIS-A (NASA), and POLDER-3/PARASOL (CNES). The mooring and monthly cruises site are located in the Ligurian Sea (Western Mediterranean Sea, Fig. 1). The water depth is 2,440 m at the mooring point (7°54’E, 43°22’N). This site has been selected in particular because currents are usually extremely low. Oligotrophic conditions (chlorophyll-a concentration below 0.1 mg.m-3) prevail at this site in summer, whereas during the spring bloom (February to March or April), chlorophyll-a concentration can reach 5 mg.m-3. the BOUSSOLE Project is composed of 3 basic and complementary elements: All designed to provide specific measurements of various parameters at different and complementary spatial and temporal scales, When combined together, they provide a comprehensive time series of near surface (0-200 m) ocean and atmosphere inherent optical properties (IOPs) and apparent optical properties (AOPs), needed to accomplish several objectives (vicarious calibration, level-2 parameters validation, bio-optics modeling, see Table 2). • From July 2001: 3- to 5-days cruises are organized on a near-monthly basis (Table 4; Fig. 1), • Each day begins and ends with a 400 m CTD cast, including as well O2 (SeaBIRD SBE13/SBE43), CDOM fluorescence (WETLabs WETStar), Chl fluorescence (Chelsea MK III AquaTracka fluorometer) and backscattering (WETLabs eco-BB3), • CTD sensors are mounted on a 12 Niskin bottles rosette for water sampling, with the 12th bottle replaced by a 25 cm path length AC9+, 6 complementary CTD casts are performed on the transect between the BOUSSOLE site and the port of Nice (every 5 nmi), • Satlantic SPMR/SMSR profiles are performed when solar zenith angle is < 80°, to get multispectral profiles of upward and downward irradiances, Eu(z, λ) and Ed(z, λ) respectively (Fig. 8), • Phytoplankton pigments (HPLC), particle absorption (filter pad) and particle dry weights are determined from water sampling and filtration, on a daily basis, • On other transects between the BOUSSOLE site and the port of Nice, when the sun is high enough and the sky is clear, CIMEL CE-317 sun photometer measurements are taken at 30 min intervals (approximately 5 nmi). Fig. 1 Table 1 coastal AErosol RObotic NETwork (AERONET) station Fig. 2 Fig. 3 Fig. 4 July 3, 2002: a coastal site (Cap Ferrat, in front of the LOV) is equipped with an automatic sun photometer station (AERONET[1], see Table 3 for a summary of its deployment). • Continuous record of sky radiances (principal plane and almucantar) and of attenuation of direct solar beam are performed, from which aerosol types and aerosol optical thickness are retrieved (calibration and data processing managed by AERONET group). • Goal: provide aerosol types and optical thickness for the vicarious calibration. [1] Further details about AERONET sites are available at http://aeronet.gsfc.nasa.gov. Fig. 7 25 m Fig. 5 Fig. 6 Table 3 Table 2 Fig. 8 Table 4 sample results Fig. 10 time series of the reflectance in the blue (442 nm, corresponding to all the data collected by the buoy from February to end of September 2005). The full range of variability of the reflectance is represented, from about 1 to 5%. The depression caused by the spring phytoplankton bloom is maximum around mid April, and the maximum of reflectance occurs at the end of July, when the chlorophyll concentration is close to its annual minimum there, i.e., about 0.1 mg.m-3. Surprisingly, however, the reflectance significantly decreases during August, whereas the chlorophyll concentration does not increase at all, remaining close to 0.1mg.m-3 (so called blue to green ratio, Claustre et al. 2002). Fig. 9 Fig. 12a, b and c phytoplankton fluorescence (dashed curve) and of the beam attenuation coefficient at 660 nm (solid curve), during a one-month period corresponding to the development of the spring bloom in 2004 (March 4 to April 7). seasonal and interannual evolution of the diffuse attenuation coefficient for wavelengths 412(a), 490(b) and 560(c) nm. The time series was established from 3 years of measurements carried out monthly (approximately) from the ships. This parameter is largely determined by the absorption coefficient, and it is thus a good indicator of the concentration of phytoplankton and associated colored dissolved substances. The seasonal cycle appears very clearly, in particular in 2003 and 2004: it starts with an intense mixing of water in winter (maximum in February, with almost homogeneous properties and weak Kd), continues with the start of the spring bloom in March-April, then evolves gradually to the oligotrophy, which is maximum around September, and which is characterized by a maximum of attenuation at about 50 m, corresponding to the deep chlorophyll maximum. Fig. 11 A typical example of the data collected daily from the buoy (15-minutes acquisition frequency) reference. Claustre, H., Morel, A., Hooker, S.B., Babin, M., Antoine, D., Oubelkheir, K., Bricaud, A., Leblanc, K., Quéguiner, B. and S. Maritorena, 2002: Is desert dust making oligotrophic waters greener? Geophys. Res. Lett., 29, 10, 10.1029/2001GL014056. acknowledgements The BOUSSOLE project was set up thanks to the work of numerous people, and thanks to the support and funding of several Agencies and Institutions. Specifically, the following contracts are acknowledged: CNES (the French space Agency) provided funds through the TAOB and TOSCA scientific committees, ESA through ESTEC contract 14393/00/NL/DC, including CCNs #1, \#2 and #3, and through ESRIN contract 17286/03/I-OL. NASA provided support through a Letter of Agreement. Funding has been also obtained from the French CSOA (INSU) committee and the Observatoire Océnologique de Villefranche. The “Institut National des Sciences de l'Univers” (INSU) provides ship time for the monthly cruises. The crews and captains of the INSU R/V “Téthys-II” are warmly thanked for their help at sea. The data that are collected for several years near the BOUSSOLE site by the French weather forecast Agency, Meteo France, and which are provided in near real time on the internet, have been of great help in the day-to-day management of the monthly cruises, as well as in the analysis of the buoy behavior. Ocean Optics XVIII, Montreal, CANADA, October 9 – 13, 2006.