Download

1 / 11
110 likes | 225 Vues
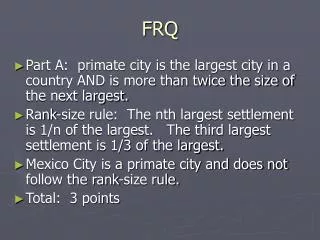
Individual Project: FRQ on the Application of Integration. By: Lily Harford May 22, 2013 Period 6-7. FRQ 2008 #1. Let R be the region bounded by the graphs of and as shown in the figure to the right. a) Find the area of R . Solution to Part A.

E N D
Individual Project: FRQ on the Application of Integration By: Lily Harford May 22, 2013 Period 6-7
FRQ 2008 #1 Let R be the region bounded by the graphs of and as shown in the figure to the right. a) Find the area of R
Solution to Part A Since this is the first question, a graphing calculator is allowed. So use it! The answer is 4
Part B b) The horizontal line y=-2 splits the region R into two parts. Write, but do not evaluate, an integral expression for the area of the part of R that is below this horizontal line. How do we find the area of the region of R (in yellow) below the line y=-2? What are the NEW intersection points?
Solution to Part B 1. Graph the two functions Set window to approximately: Xmin=0 Xmax=5 Ymin=1 Ymax=2 2. 2nd TRACE INTERSECT 3. Move the cursor along the first and second curves to the first point of intersection. Click “Enter” for “Guess?” 4. Move the cursor along the first and second curves to the second point of intersection. Click “Enter” for “Guess?” 5. You should arrive at x=0.53191887 and x=1.6751309 Answer: How did I arrive at that answer? Find the two points where y= -2 and intersect (see left side of screen for instructions) Which equation is the upper equation? Which equation is the lower equation?(see next slide) Finally, put all known values into our formula: The directions state “do not evaluate.”
Solution to Part B Y=-2 is now the upper function The new lower function is (-2- ) because you are looking for the area of a specific piece of R that is under y=-2. Answer:
Part C c) The region R is the base of a solid. For this solid, each cross section perpendicular to the x-axis is a square. Find the volume of this solid. Keywords: Cross section perpendicular to the x-axis is a square The “Lily H” Translation: No in the equation to find Volume. 2. Equations stay in the “y equals” format (y=?) instead of “x equals”(x=?) format. 3. Area of a square=
Part D d) The region R models the surface of a small pond. At all points in R at a distance x from the y-axis, the depth of the water is given by h(x)=3-x. Find the volume of water in the pond.
Solution to Part D The area “R” is the product of length and width. Height = Depth = h(x) which is given in the equation.
References http://apcentral.collegeboard.com/apc/public/repository/ap08_calculus_ab_q1.pdf - Where the FRQ came from