Download
1 / 21
210 likes | 402 Vues
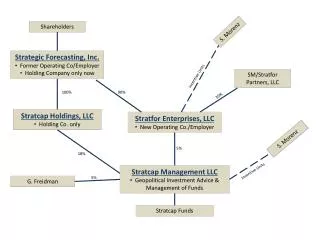
ANZ Delivering for Shareholders. Presentation to CLSA Investors’ Forum 2000 John McFarlane, Chief Executive Officer 16 May 2000. ANZ. One of the ‘Big Four” Australian banks. Provider of full range of financial services in Australia (since 1835) and

E N D
ANZ Delivering for Shareholders Presentation to CLSA Investors’ Forum 2000 John McFarlane, Chief Executive Officer 16 May 2000
ANZ One of the ‘Big Four” Australian banks. Provider of full range of financial services in Australia (since 1835) and New Zealand (since 1840) with leadership in Corporate Banking, Credit Cards and Trade, an emerging strong e-Commerce position and an offshore network in Asia and Pacific (Grindlays sale announced 27 April). • Assets $167b • Market Cap $17.5b • Profit (first half 00) $817m • Staff 28,940 • Credit Rating AA-/Aa3 ANZ Headquarters 100 Queen Street Melbourne
ANZ Delivers on Financial Commitments March 2000 Results • Double-digit earnings growth 14%. EPS 10% • Increase ROE towards 20% 17.8% (17.3%) • 53% cost income ratio 51.4% Costs flat • Reduce risk Matches peers ex Grindlays • Achieve an optimal capital structure $500m buyback completed $1bn buyback announced
Financial Performance EPS Tier 1 Ratio ¢ % % ROE Lending Mix % Cost Income Ratio % Mortgages Emerging Markets WBC CBA NAB ANZ
Business Unit Performance Other 8% Personal 45% International 9% A$ Corporate 38%
Change in Profit Sale of Strategic Investments 33 Other Income 17 $m Property Revaluation 30 Other Fee Growth 30 Doubtful Debts (4) 850 Lending Fee 20 Costs (9) Net Interest Income 34 817 Restatement of Deferred Tax Balance (64) Tax (34) 800 764 750 Significant one off items (1) 700 650 600 Second Half 1999 First Half 2000
Improving Asset Quality General Provision Non Accrual Loans $m $m Foreign Exchange Impact (18) 2000 762 1436 1395 1500 Surplus 886 Net Transfer to Specific Provision (197) 871 ELP Charge 256 944 1000 444 900 500 657 554 428 0 Sep 99 Mar 00 APRA Guidelines Minimum 1997 1998 1999 1H00 Net Non Accrual Loans Specific Provisions
Capital Management a Priority % Ratios • Capital management objective • Increase ROE • Maintain AA status • Targets • Tier 1 6.5 - 7.0% • Inner Tier 1 6.0% - 6.5% • Reducing excess • $500m buyback completed • $1bn buyback in process Inner Tier 1 Hybrid Tier 1 Net Tier 2
Outcomes Mortgage & cards share up Personal 45% of group profit FM challenging, new team Leadership position enhanced ROA 0.9% (0.7%) Non accruals 0.4% (0.9%) Grindlays sale Latin America Offices closed Asia-Pacific e-Commerce focus Approaching leadership B2C Strong portfolio B2B Web enabled internal processes Numerous venture investments Good Progress on Business Strategies Business Strategy • Accelerate growth in Personal • Build on strength in Corporate • Simplify and focus International • Build leadership in e-Commerce
Momentum in Personal Share of Credit Card Spend Share of Housing Lending % % Internet Banking Users as % of Main Relationships Internet Banking Registrations 1998 1999 2000 Source: Ord Minnett and Roy Morgan Research
Leadership in Corporate Business Banking Relationships AustralianMarket Share 1999 (%) • Pre-eminent Corporate Bank in Australia and New Zealand in terms of relationships and customer satisfaction • Leader in Treasury Products (FX, Risk Management) • Esanda/UDC No1 Finance Company in Australia and New Zealand • Leading Structured Finance Specialist in Asia • No 1 in Trade in Australia Customer Perception of Service Delivery 1999 (out of 10)
Sale of Grindlays • Price US$1.3 (A$2.2)bn • Net Asset Value US$590 (A$990)m • Goodwill US$750 ($A1,250)m • Dividends $US0.5 (A$0.9) billion from Grindlays retained earnings • Price multiples (excluding dividend) • 2.3 times net asset value, 14.2 times annualised first half 2000 earnings • Cooperation Agreement with SCB to service ANZ customers • Final consideration subject to Net Asset Value at completion • Customary representations and warranties • Indemnity regarding litigation matters including NHB • Completion expected 3Q subject to regulatory approval
ANZ Profile Group Growth Grindlays • Assets $167b $14b $10b • Profit $817m $53m $79m • Staff 28,940 -1231 5400 • Representation 39 14 ANZ Headquarters 100 Queen Street Melbourne
Delivering via the Web B2B E-Procurement FX On-line(ANZ On-Line) Identrus Transformation Directors on line ERP operations.com Sales & Service Platform Enterprise Resource Planning Employee PCs B2C
Strategic Imperatives Accelerate the growth program across 3 horizons Radical transformation of the business Improve sustainability of core franchises
Strategic Imperatives Accelerate the growth program across 3 horizons • Reallocate investment towards current traditional growth opportunities • Build substantial portfolio of e-products and businesses • Build semi-global niche positions in trade, FX, structured finance, cards and e-Commerce • Rapidly roll-out e-Commerce investments in Asia
Strategic Imperatives Accelerate the growth program across 3 horizons Radical transformation of the business • Revolutionise cost base to compete with new economy competitors • Embrace web technology to achieve seamless integration • Become a customer-centric company by organising around different customer segments • Build culture and talent to compete in the new economy
Strategic Imperatives Accelerate the growth program across 3 horizons Radical transformation of the business Improve sustainability of core franchises • Continue to expand leadership in Corporate • Complete domestic Personal footprint • organically • infill acquisitions • Address retail funds management strategic position • Medium-term search for transformational moves • Improve capacity to participate in industry consolidation on our terms
Financial Goals Going forward • Earnings per share growth that outperforms the average of our peer banks • Increase Return on Equity: Target 20% • Cost income ratio comfortably below 50% • Inner Tier 1 ratio approaching 6% • Maintenance of credit rating in AA category
Copy of Presentation available on www.anz.com
The material in this presentation is general background information about the Bank’s activities current at the date of the presentation. It is information given in summary form and does not purport to be complete. It is not intended to be relied upon as advice to investors or potential investors and does not take into account the investment objectives, financial situation or needs of any particular investor. These should be considered, with or without professional advice when deciding if an investment is appropriate. For further information visit www.anz.com or contact David Ward General Manager Office of the Chief Executive ph: (613) 9273 4185 fax: (613) 9273 4091 email: david.ward@anz.com