Download
1 / 1
10 likes | 88 Vues
Influence of Tropical Biennial Oscillation on Carbon Dioxide Jingqian Wang 1 , Xun Jiang 1 , Moustafa T. Chahine 2 , Edward T. Olsen 2 , Luke L. Chen 2 , Maochang Liang 3 , and Yuk L. Yung 4

E N D
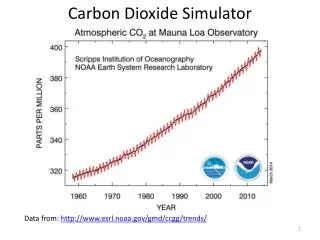
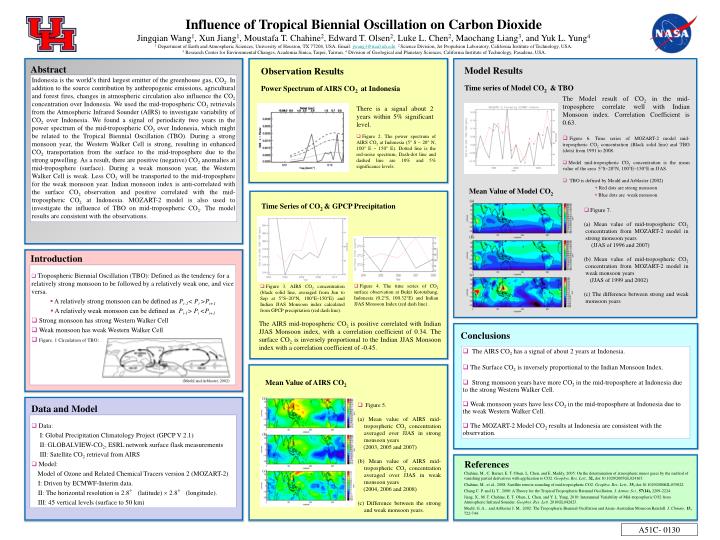
Influence of Tropical Biennial Oscillation on Carbon Dioxide • Jingqian Wang1, Xun Jiang1, Moustafa T. Chahine2, Edward T. Olsen2, Luke L. Chen2, Maochang Liang3, and Yuk L. Yung4 1 Department of Earth and Atmospheric Sciences, University of Houston, TX 77204, USA. Email: jwang3@mail.uh.edu2 Science Division, Jet Propulsion Laboratory, California Institute of Technology, USA. 3 Research Center for Environmental Changes, Academia Sinica, Taipei, Taiwan. 4Division of Geological and Planetary Sciences, California Institute of Technology, Pasadena, USA. Abstract Model Results Time series of Model CO2 & TBO Observation Results Power Spectrum of AIRS CO2 at Indonesia Indonesia is the world’s third largest emitter of the greenhouse gas, CO2. In addition to the source contribution by anthropogenic emissions, agricultural and forest fires, changes in atmospheric circulation also influence the CO2 concentration over Indonesia. We used the mid-tropospheric CO2 retrievals from the Atmospheric Infrared Sounder (AIRS) to investigate variability of CO2 over Indonesia. We found a signal of periodicity two years in the power spectrum of the mid-tropospheric CO2 over Indonesia, which might be related to the Tropical Biennial Oscillation (TBO). During a strong monsoon year, the Western Walker Cell is strong, resulting in enhanced CO2 transportation from the surface to the mid-troposphere due to the strong upwelling. As a result, there are positive (negative) CO2 anomalies at mid-troposphere (surface). During a weak monsoon year, the Western Walker Cell is weak. Less CO2 will be transported to the mid-troposphere for the weak monsoon year. Indian monsoon index is anti-correlated with the surface CO2 observation and positive correlated with the mid-tropospheric CO2 at Indonesia. MOZART-2 model is also used to investigate the influence of TBO on mid-tropospheric CO2. The model results are consistent with the observations. • The Model result of CO2 in the mid-troposphere correlate well with Indian Monsoon index. Correlation Coefficient is 0.63. • Figure 6. Time series of MOZART-2 model mid-tropospheric CO2 concentration (Black solid line) and TBO (dots) from 1991 to 2008. • Model mid-tropospheric CO2 concentration is the mean value of the area 5S~20N, 100E~150E in JJAS. • TBO is defined by Meahl and Arblaster (2002) • Red dots are strong monsoon • Blue dots are weak monsoon There is a signal about 2 years within 5% significant level. • Figure 2. The power spectrum of AIRS CO2 at Indonesia (5 S ~ 20 N, 100 E ~ 150 E). Dotted line is the red-noise spectrum, Dash-dot line and dashed line are 10% and 5% significance levels. Mean Value of Model CO2 (a) Time Series of CO2 & GPCP Precipitation • Figure 7. (a) Mean value of mid-tropospheric CO2 concentration from MOZART-2 model in strong monsoon years (JJAS of 1996 and 2007) (b) Mean value of mid-tropospheric CO2 concentration from MOZART-2 model in weak monsoon years (JJAS of 1999 and 2002) (c) The difference between strong and weak monsoon years (b) Introduction • Tropospheric Biennial Oscillation (TBO):Defined as the tendency for a relatively strong monsoon to be followed by a relatively weak one, and vice versa. • A relatively strong monsoon can be defined as Pi-1< Pi >Pi+1 • A relatively weak monsoon can be defined as Pi-1> Pi <Pi+1 • Strong monsoon has strong Western Walker Cell • Weak monsoon has weak Western Walker Cell • Figure. 1 Circulation of TBO: (c) • Figure 4. The time series of CO2 surface observation at Bukit Kototabang, Indonesia (0.2S, 100.32E) and Indian JJAS Monsoon Index (red dash line) . • Figure 3. AIRS CO2 concentration (black solid line, averaged from Jun to Sep at 5S~20N, 100E~150E) and Indian JJAS Monsoon index calculated from GPCP precipitation (red dash line). The AIRS mid-tropospheric CO2 is positive correlated with Indian JJAS Monsoon index, with a correlation coefficient of 0.34. The surface CO2 is inversely proportional to the Indian JJAS Monsoon index with a correlation coefficient of -0.45. Conclusions • The AIRS CO2 has a signal of about 2 years at Indonesia. • The Surface CO2 is inversely proportional to the Indian Monsoon Index. • Strong monsoon years have more CO2 in the mid-troposphere at Indonesia due to the strong Western Walker Cell. • Weak monsoon years have less CO2 in the mid-troposphere at Indonesia due to the weak Western Walker Cell. • The MOZART-2 Model CO2 results at Indonesia are consistent with the observation. Mean Value of AIRS CO2 (Meehl and Arblaster, 2002) (a) • Figure 5. (a) Mean value of AIRS mid-tropospheric CO2 concentration averaged over JJAS in strong monsoon years (2003, 2005 and 2007) (b) Mean value of AIRS mid-tropospheric CO2 concentration averaged over JJAS in weak monsoon years (2004, 2006 and 2008) (c) Difference between the strong and weak monsoon years. Data and Model • Data: • I: Global Precipitation Climatology Project (GPCP V 2.1) • II: GLOBALVIEW-CO2, ESRL network surface flask measurements • III: Satellite CO2 retrieval from AIRS • Model: Model of Ozone and Related Chemical Tracers version 2 (MOZART-2) I: Driven by ECMWF-Interim data. II: The horizontal resolution is 2.8° (latitude) 2.8° (longitude). III: 45 vertical levels (surface to 50 km) (b) References (c) Chahine, M., C. Barnet, E. T. Olsen, L. Chen, and E. Maddy, 2005: On the determination of atmospheric minor gases by the method of vanishing partial derivatives with application to CO2. Geophys. Res. Lett., 32, doi:10.1029/2005GL024165. Chahine, M., et al., 2008: Satellite remote sounding of mid-tropospheric CO2. Geophys. Res. Lett.,35, doi:10.1029/2008GL035022. Chang C. P. and Li T., 2000: A Theory for the Tropical Tropospheric Biennial Oscillation. J. Atmos. Sci.,57(14), 2209-2224. Jiang, X., M. T. Chahine, E. T. Olsen, L. Chen, and Y. L. Yung, 2010: Interannual Variability of Mid-tropospheric CO2 from Atmospheric Infrared Sounder. Geophys. Res. Lett. 2010GL042823. Meehl, G. A., and Arblaster J. M., 2002: The Tropospheric Biennial Oscillation and Asian–Australian Monsoon Rainfall. J. Climate, 15, 722-744. Table 1: Variances, spectral peaks, and correlations (Lag = 0) for the first modes of the sea surface temperature, tropopause pressure, and column ozone. The numbers in parentheses denote significance levels. A51C- 0130