Download
1 / 104
1.08k likes | 1.32k Vues
Canadian Oil and Gas. Sanjeev Gill | Mohammed Alshanakhnakh | Hans Melis | Alexandrine Austin. Overview. Introduction Industry Overview Risk Analysis Canadian Natural Resources Corporate Profile Risk Analysis Penn West Corporate Profile Risk Management

E N D
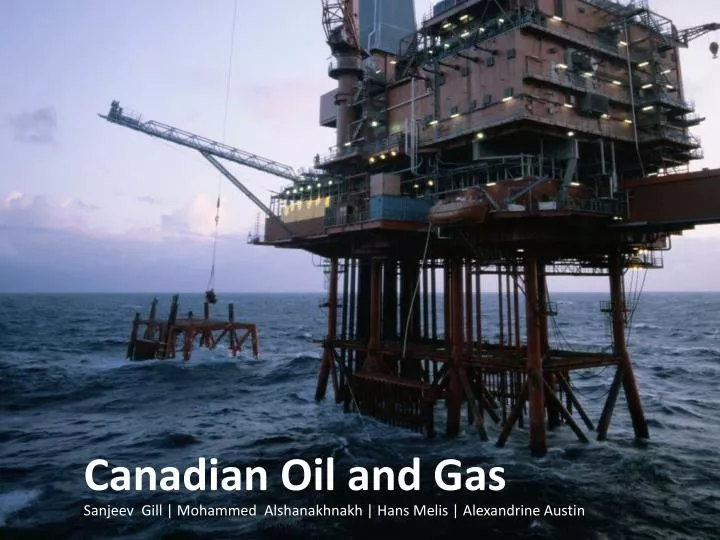
Canadian Oil and Gas Sanjeev Gill | Mohammed Alshanakhnakh | Hans Melis | Alexandrine Austin
Overview • Introduction • Industry OverviewRisk Analysis • Canadian Natural Resources • Corporate ProfileRisk Analysis • Penn West • Corporate ProfileRisk Management • Risk Overview of other Competitors • Conclusion: Recommendations
Products Crude Oil • Gasoline • Heating Oil • Liquefied Petroleum Gas • Kerosene • Jet Fuel • Lubricants Natural Gas
Major Substitutes • Coal • Nuclear energy • Biomass • Biogas • Solar power • Wind power • Geothermal • Tidal power
Major Costs Incurred • Acquisition Costs • Exploration Costs • Developmental Costs • Production Costs
Major Canadian Producers • EnCana Corporation • Canadian Natural Resources Limited • Husky Energy Inc. • Talisman Energy Inc. • Suncor Energy • CenovusEnergy • Penn West Energy Trust • Nexen
Correlation between Natural Gas and Oil Prices Crude Oil Prices (2005- 2011)
Key Economic Events 2008 Financial Crisis • Reduced access to credit • Decreased demand • Decreased liquidity • Increased regulations • Increased supply • Decreased commodity price
Global Regulation Organization of the Petroleum Exporting Countries (OPEC) • Iran, Iraq, Kuwait, Saudi Arabia, Venezuela, Qatar, Libya, Algeria , Nigeria, Ecuador, Angola, and United Arab Emirates. • Unify Petroleum Policies • Secure stable prices for producers
Canadian Regulation • National Energy Board (NEB) • Office of Energy Efficiency (OEE) • Environment Canada • Canadian Association of Petroleum Producers (CAPP) • Kyoto Protocol • Reduce carbon emissions
Price Volatility • OPEC and domestic regulations • Geopolitical and Financial Events • Alternative energy sources • World Supply and Demand • Seasonality
Risk Exposure • Operational Risk • Economic and Political Risk • Commodity Risk • Financial Risk • Interest Rate Risk and FX Risk • Credit and Liquidity Risk • Regulatory Limitations • Exploration and Development
Risk Measurement • Sensitivity analysis • Simulation Analysis • Probability Estimation • Value at Risk (VaR)
Risk Management • Diversification and Insurance • OTC Forward Contracts • Exchange-Traded Energy Futures • Foreign Exchange Futures • Hedging through Options
Hedging Techniques for Risk Management • Collar Hedge • Crack spread contracts and options • Interest rate swaps • FX swaps
Risk Management Expense • Increased Organizational Expense • Hedging Risks • Credit Risk
Effective Risk Management • Affordability
Corporate Overview • Calgary, Alberta based explorer, producer, and developer of oil and natural gas • Founded in 1973 • Since then, has grown to become both the 2nd largest natural gas producer and the largest heavy oil producer in Canada • Energy products include: natural gas, light oil, heavy oil, in-situ oil sands production, oil sands mining and associated upgrading facilities
Corporate Overview • Key factors of their business approach: • Lowest cost producer strategy • Exploitation focus using existing technologies, discoveries, and breakthroughs • Strategic acquisitions, often in existing core regions, to increase operational diversification • Avoid long-term drilling/supply contracts when possible to increase flexibility • Seek to own and operate 100% of their assets • Effective balance between heavy crude oil, light crude oil, and natural gas provides some protection against commodity price risk • Financial strength is of paramount importance • -Target strong debt ratings and manage liquidity “as a core asset” • -closely controlled hedging activities provide short-term cash flow certainty
Stock Details (Mar. 9, 2011) • As of March 1, 2011, roughly 1.01 billion CNQ shares outstanding • Also trades on the NYSE
Historical Stock Performance & Activity • 10 year price movement • Moving average highlights overall long-term upward trend
Summary of Operations • Canadian Natural relies on a North American foundation • Hold the largest undeveloped land base in the Western Canadian Sedimentary Basin
Operations – Horizon Oil Sands • Key oil sands asset located north of Fort McMurray, Alberta, with ongoing expansion • Supports 232,000 – 250,000 barrels per day of light, sweet, crude oil production for over 40 years, with no production declines (recoverable OOIP of 6 billion barrels estimated)
Operations – North American Net Oil & Gas Reserves • Figures are net of royalties • Obvious uncertainty around the determination of “probable” reserves, which claim a 50% confidence level of recovery
Operations - International • Provide a strategic source of primarily crude oil (though in much lower quantities than North American operations) • Locations: the North Sea and Offshore West Africa (Espoir, Baobab, Olowi)
Management Compensation (2009) & Background $10, 578, 701.00 (includes option awards) BSc in Chemical Engineering $10,009,651.00 (includes option awards) BSc in Mechanical Engineering
Financial Performance • Canadian Natural refers to “four metrics” that measure corporate success: Horizon Oil Sands
Consolidated Statement of Earnings (for the year ended December 31)
Adjusted Net Earnings from Operations • Changes in the intrinsic value of outstanding vested options are recognized in net earnings (stock-based compensation expense) • Changes in fair value of non-designated hedges are recognized in net earnings • Unrealized foreign exchange gains and losses, offset by cross currency swaps, are recognized in net earnings
Consolidated Statements of Cash Flows (for the year ended December 31)
Corporate Approach to Risk Management • Hedge program aims to give the company certainty in their short-term cash flows • Ensures adequate financing for capital plans • Derivatives usage is solely aimed at managing the various types of risk exposure, not for speculative activity • Operational risks limited through a focused effort on large core areas and by operating key facilities • Product and operations diversity important
Market Risk 3 Primary Types:
Commodity Price Risk • Fluctuations in commodity prices impact Canadian Natural’s cash flows associated with commodities that are sold and purchased • Sales to hedge: • Futures crude oil and natural gas production • Purchases to hedge: • Natural gas
Interest Rate Risk • 2 sources of interest rate risk to be dealt with: • Interest rate price (fair value) risk on the company’s fixed rate long-term debt • Interest rate cash flow risk on the company’s floating rate long-term debt
Foreign Currency Exchange Rate Risk • Primary source is the company’s US dollar denominated long-term debt and working capital • Also exposed because of: • transactions conducted in other currencies (in its subsidiaries) • Carrying value of self-sustaining foreign subsidiaries
Commodity Price Risk Management Net derivative financial instruments outstanding (Dec. 31, 2010): The Company’s outstanding commodity derivative financial instruments are expected to be settled monthly based on the applicable index pricing for the respective contract month.
Interest Rate Risk Management • Interest rate swap contracts outstanding (Dec. 31, 2010): • The interest rate swap contracts require the periodic exchange of payments without the exchange of the notional principal amounts on which the payments are based