Download
1 / 6
60 likes | 194 Vues
Supplement Fig. I. A. P2. P6. P10. Ctrl. 40. Hcy. 35. 30. #. Ctrl. *. *. 25. #. *. 20. S phase cells (%). 15. 10. Hcy. 5. 0. P2. P6. P10. B. P2. P6. P10. #. 80. *. Ctrl. 70. Hcy. Ctrl. 60. 50. *. 40. Apoptosis celsl (%). #. *. 30. Hcy. 20. 10. 0.

E N D
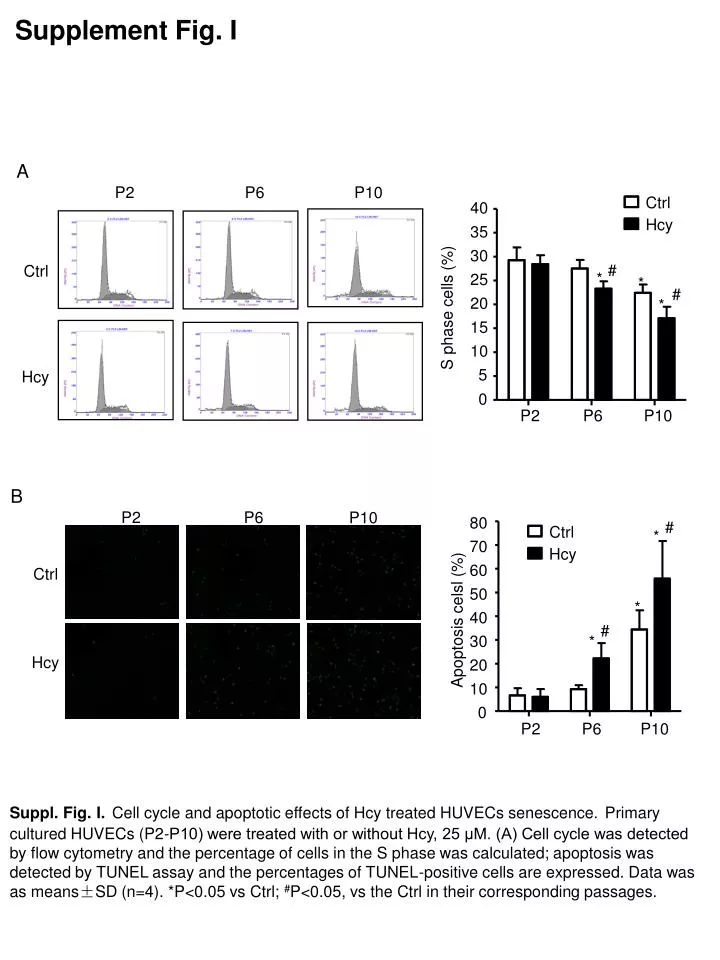
Supplement Fig. I A P2 P6 P10 Ctrl 40 Hcy 35 30 # Ctrl * * 25 # * 20 S phase cells (%) 15 10 Hcy 5 0 P2 P6 P10 B P2 P6 P10 # 80 * Ctrl 70 Hcy Ctrl 60 50 * 40 Apoptosis celsl (%) # * 30 Hcy 20 10 0 P2 P6 P10 Suppl. Fig. I.Cell cycle and apoptotic effects of Hcy treated HUVECs senescence.Primary cultured HUVECs (P2-P10) were treated with or without Hcy, 25 μM. (A) Cell cycle was detected by flow cytometry and the percentage of cells in the S phase was calculated; apoptosis was detected by TUNEL assay and the percentages of TUNEL-positive cells are expressed. Data was as means±SD (n=4). *P<0.05 vs Ctrl; #P<0.05, vs the Ctrl in their corresponding passages.
Supplement Fig. II A 2.5 2.0 * 1.5 # eNOS mRNA expression # 1.0 ** 0.5 0.0 FA Hcy Ctrl LAR FA+Hcy LAR+Hcy B 8 ** 6 # # 4 iNOS mRNA expression 2 0 FA Hcy Ctrl LAR FA+Hcy LAR+Hcy Suppl. Fig. II. Effect of Hcy on eNOS and iNOS expression. (A) qRT-PCR of eNOS (B) and iNOS (C) mRNA expression in HUVECs (P4-P6) treated with Hcy, 50 μM, with or without pre-supplementation with FA (100 μM) or SAM (100 μM) for 1 hr. *P<0.05, **P<0.01vs. P2 control; #P<0.05 vs. Hcy. Data are mean±SD (n=4).
100 80 60 40 20 0 Supplement Fig. III B A 2.0 Ctrl 1.8 Hcy 1.5 1.5 (Fold of control) * λ * 1.2 λ T/S ratio * 1.0 mRNA relative level * 0.9 0.6 0.5 0.3 0.0 0.0 hTRET hTR TRF2 hTP1 P10 P2 P4 P6 P8 C D 50 2.5 * * * * * 2.0 40 ※ # # & * & 1.5 # 30 ※ ※ ※ * * * * 1.0 20 -gal positive rate (%) 0.5 hTERT mRNA expression 10 0.0 0 FA Ctrl Hcy FA LAR Ctrl Hcy SAM LAR SAM Ang II Ang II FA+Hcy FA+Hcy b LAR+Hcy 5-aza-CdR SAM+Hcy FA+Ang II LAR+Hcy LAR+Ang II 5-aza-CdR SAM+Hcy FA+Ang II SAM+Ang II LAR+Ang II SAM+Ang II FA+5-aza-CdR FA+5-aza-CdR LAR+5-aza-CdR SAM+5-aza-CdR LAR+5-aza-CdR SAM+5-aza-CdR E Ang II Ctrl Hcy 5-aza DM M U M U M U M U * Methylation ratio(%) * Suppl. Fig. III. Hcy stimulated EC senescence by restoring human telomerase reverse transcriptase (hTERT) activity via DNA hypomethylation. (A) qPCR analysis of relative telomerase length (T/S ratio in P2-P10 HUVECs treated with Hcy or not, 25 μM. (B) qRT-PCR analysis of mRNA expression of hTERT, hTR, TRF2 and hTP1 relative to PBS control with Hcy, 50 μM, for 72 hr in P4-P6 HUVECs. β-actin was an internal control. (C) Proportion of SA-β-gal–positive cells to PBS control and (D) qRT-PCR analysis of hTERT mRNA expression in HUVECs with Hcy (50 μM), angiotensin II (Ang II, 100 μM) or 5-aza (8 μM) with or without pre-supplementation with FA (100 μM), L-arginine (LAR, 50 μM) or SAM (100 μM). (E) MSP assay of hTERT methylation in HUVECs with Hcy, Ang II or 5-aza treatment. *P<0.05 vs. PBS control, # P<0.05 vs. Hcy, §P<0.05 vs. Ang II, ※P<0.05 vs. 5-aza. Data are mean±SD (n=4 for T/S ratio assay; n=5 for qPCR, MSP and SA-β-gal staining assay, as well as 2 parallel samples were measured each time).
Supplement Fig. IV A Si-Ctrl Si-CTCF 1.50 1.25 CTCF 1.00 CTCF mRNA relative level 0.75 0.50 * 0.25 TBP 0.00 Si-Ctrl Si-CTCF B Si-Ctrl Si-SP1 1.50 1.25 SP1 1.00 SP1 mRNA relative level 0.75 ** 0.50 TBP 0.25 0.00 Si-Ctrl Si-SP1 C 1.50 Si-Ctrl Si-DNMT1 1.25 DNMT1 1.00 0.75 DNMT1 mRNA relative level ** 0.50 0.25 TBP 0.00 Si-Ctrl Si-DNMT1 Suppl. Fig. IV. Knockdown of SP1, CTCF and DNMT1 by si-RNA in HUVECs. qRT-PCR and Western blot analysis of expression of CTCF (A), SP1 (B) and DNMT1 (C), after P4 HUVECs were transfected with 40-nM siRNA for SP1, CTCF and DNMT1 or scramble siRNA control (si-Ctrl) for 12 hr. Data are mean±SD (n=4). TATA binding protein (TBP) was an internal control. *P<0.05 vs si-Ctrl transfection.
Input Hcy Ctrl SP1 CTCF IP: SP1 IgG Hcy Ctrl CTCF IgG SP1 IP: CTCF IgG Hcy Ctrl SP1 IgG CTCF Supplement Fig. V A B C Supplement Fig. V Interaction analysis between SP1 and CTCF by co-immunoprecipitation in P4 HUVECs treated with or without Homocysteine (50 μmol/L) for 72 hr. The experiments were performed in 4 independent times.
Supplement Fig. VI A 8 * 6 * 4 NOX4 mRNA expression 2 0 Ctrl HHcy Ctrl HHcy 8 W 4 W B NOX4 Ctrl DIPA NOX4 HHcy DIPA 4 W 8 W Suppl. Fig. VI. NOX4 expression in aortic intima of hyper-Hcy (HHcy) mice. C57 mice were fed standard chow with or without 2% methionine for 4 and 8 weeks (n=8, in each group). (A) qRT-PCR analysis of NOX4 mRNA level in aortic intima. Normalization was to mouse β-actin level. *P<0.05 vs Ctrl group. (B) Representative immunohistochemical staining of NOX4 (red) and nuclei (blue) in cross sections of aortas from HHcy and control mice.