Download
1 / 65
650 likes | 827 Vues
Data Warehouses, Decision Support and Data Mining. University of California, Berkeley School of Information Management and Systems SIMS 257: Database Management. Review Data Warehouses

E N D
Data Warehouses, Decision Support and Data Mining University of California, Berkeley School of Information Management and Systems SIMS 257: Database Management
Review Data Warehouses (Based on lecture notes from Joachim Hammer, University of Florida, and Joe Hellerstein and Mike Stonebraker of UCB) Applications for Data Warehouses Decision Support Systems (DSS) OLAP (ROLAP, MOLAP) Data Mining Thanks again to lecture notes from Joachim Hammer of the University of Florida Lecture Outline
Problem: Heterogeneous Information Sources “Heterogeneities are everywhere” Personal Databases World Wide Web Scientific Databases Digital Libraries • Different interfaces • Different data representations • Duplicate and inconsistent information Slide credit: J. Hammer
Problem: Data Management in Large Enterprises • Vertical fragmentation of informational systems (vertical stove pipes) • Result of application (user)-driven development of operational systems Sales Planning Suppliers Num. Control Stock Mngmt Debt Mngmt Inventory ... ... ... Sales Administration Finance Manufacturing ... Slide credit: J. Hammer
Goal: Unified Access to Data Integration System World Wide Web Personal Databases Digital Libraries Scientific Databases • Collects and combines information • Provides integrated view, uniform user interface • Supports sharing Slide credit: J. Hammer
The Traditional Research Approach • Query-driven (lazy, on-demand) Clients Metadata Integration System . . . Wrapper Wrapper Wrapper . . . Source Source Source Slide credit: J. Hammer
The Warehousing Approach Clients Data Warehouse Metadata Integration System . . . Extractor/ Monitor Extractor/ Monitor Extractor/ Monitor . . . Source Source Source • Information integrated in advance • Stored in WH for direct querying and analysis Slide credit: J. Hammer
“A Data Warehouse is a subject-oriented, integrated, time-variant, non-volatile collection of data used in support of management decision making processes.” -- Inmon & Hackathorn, 1994: viz. Hoffer, Chap 11 What is a Data Warehouse?
A Data Warehouse is... • Stored collection of diverse data • A solution to data integration problem • Single repository of information • Subject-oriented • Organized by subject, not by application • Used for analysis, data mining, etc. • Optimized differently from transaction-oriented db • User interface aimed at executive decision makers and analysts
… Cont’d • Large volume of data (Gb, Tb) • Non-volatile • Historical • Time attributes are important • Updates infrequent • May be append-only • Examples • All transactions ever at WalMart • Complete client histories at insurance firm • Stockbroker financial information and portfolios Slide credit: J. Hammer
“Ingest” Clients Data Warehouse Metadata Integration System . . . Extractor/ Monitor Extractor/ Monitor Extractor/ Monitor . . . Source/ File Source / DB Source / External
Applications for Data Warehouses Decision Support Systems (DSS) OLAP (ROLAP, MOLAP) Data Mining Thanks again to slides and lecture notes from Joachim Hammer of the University of Florida, and also to Laura Squier of SPSS, Gregory Piatetsky-Shapiro of KDNuggets and to the CRISP web site Today Source: Gregory Piatetsky-Shapiro
Trends leading to Data Flood • More data is generated: • Bank, telecom, other business transactions ... • Scientific Data: astronomy, biology, etc • Web, text, and e-commerce • More data is captured: • Storage technology faster and cheaper • DBMS capable of handling bigger DB Source: Gregory Piatetsky-Shapiro
Examples • Europe's Very Long Baseline Interferometry (VLBI) has 16 telescopes, each of which produces 1 Gigabit/second of astronomical data over a 25-day observation session • storage and analysis a big problem • Walmart reported to have 24 Tera-byte DB • AT&T handles billions of calls per day • data cannot be stored -- analysis is done on the fly Source: Gregory Piatetsky-Shapiro
Growth Trends • Moore’s law • Computer Speed doubles every 18 months • Storage law • total storage doubles every 9 months • Consequence • very little data will ever be looked at by a human • Knowledge Discovery is NEEDED to make sense and use of data. Source: Gregory Piatetsky-Shapiro
Knowledge Discovery Definition • Knowledge Discovery in Data is the • non-trivial process of identifying • valid • novel • potentially useful • and ultimately understandable patterns in data. • from Advances in Knowledge Discovery and Data Mining, Fayyad, Piatetsky-Shapiro, Smyth, and Uthurusamy, (Chapter 1), AAAI/MIT Press 1996 Source: Gregory Piatetsky-Shapiro
Related Fields Machine Learning Visualization Data Mining and Knowledge Discovery Statistics Databases Source: Gregory Piatetsky-Shapiro
__ ____ __ ____ __ ____ Patterns and Rules Knowledge Discovery Process Integration Interpretation & Evaluation Knowledge Data Mining Knowledge RawData Transformation Selection & Cleaning Understanding Transformed Data Target Data DATA Ware house Source: Gregory Piatetsky-Shapiro
What is Decision Support? • Technology that will help managers and planners make decisions regarding the organization and its operations based on data in the Data Warehouse. • What was the last two years of sales volume for each product by state and city? • What effects will a 5% price discount have on our future income for product X? • Increasing common term is KDD • Knowledge Discovery in Databases
Conventional Query Tools • Ad-hoc queries and reports using conventional database tools • E.g. Access queries. • Typical database designs include fixed sets of reports and queries to support them • The end-user is often not given the ability to do ad-hoc queries
OLAP • Online Line Analytical Processing • Intended to provide multidimensional views of the data • I.e., the “Data Cube” • The PivotTables in MS Excel are examples of OLAP tools
Operations on Data Cubes • Slicing the cube • Extracts a 2d table from the multidimensional data cube • Example… • Drill-Down • Analyzing a given set of data at a finer level of detail
Star Schema • Typical design for the derived layer of a Data Warehouse or Mart for Decision Support • Particularly suited to ad-hoc queries • Dimensional data separate from fact or event data • Fact tables contain factual or quantitative data about the business • Dimension tables hold data about the subjects of the business • Typically there is one Fact table with multiple dimension tables
Star Schema for multidimensional data Product ProdNo ProdName Category Description … Order OrderNo OrderDate … Fact Table OrderNo Salespersonid Customerno ProdNo Datekey Cityname Quantity TotalPrice Customer CustomerName CustomerAddress City … Date DateKey Day Month Year … City CityName State Country … Salesperson SalespersonID SalespersonName City Quota
Data Mining • Data mining is knowledge discovery rather than question answering • May have no pre-formulated questions • Derived from • Traditional Statistics • Artificial intelligence • Computer graphics (visualization)
Goals of Data Mining • Explanatory • Explain some observed event or situation • Why have the sales of SUVs increased in California but not in Oregon? • Confirmatory • To confirm a hypothesis • Whether 2-income families are more likely to buy family medical coverage • Exploratory • To analyze data for new or unexpected relationships • What spending patterns seem to indicate credit card fraud?
Data Mining Applications • Profiling Populations • Analysis of business trends • Target marketing • Usage Analysis • Campaign effectiveness • Product affinity • Customer Retention and Churn • Profitability Analysis • Customer Value Analysis • Up-Selling
How Can We Do Data Mining? • By Utilizing the CRISP-DM Methodology • a standard process • existing data • software technologies • situational expertise Source: Laura Squier
Framework for recording experience Allows projects to be replicated Aid to project planning and management “Comfort factor” for new adopters Demonstrates maturity of Data Mining Reduces dependency on “stars” Why Should There be a Standard Process? The data mining process must be reliable and repeatable by people with little data mining background. Source: Laura Squier
Process Standardization • CRISP-DM: • CRoss Industry Standard Process for Data Mining • Initiative launched Sept.1996 • SPSS/ISL, NCR, Daimler-Benz, OHRA • Funding from European commission • Over 200 members of the CRISP-DM SIG worldwide • DM Vendors - SPSS, NCR, IBM, SAS, SGI, Data Distilleries, Syllogic, Magnify, .. • System Suppliers / consultants - Cap Gemini, ICL Retail, Deloitte & Touche, … • End Users - BT, ABB, Lloyds Bank, AirTouch, Experian, ... Source: Laura Squier
CRISP-DM • Non-proprietary • Application/Industry neutral • Tool neutral • Focus on business issues • As well as technical analysis • Framework for guidance • Experience base • Templates for Analysis Source: Laura Squier
The CRISP-DM Process Model Source: Laura Squier
Why CRISP-DM? • The data mining process must be reliable and repeatable by people with little data mining skills • CRISP-DM provides a uniform framework for • guidelines • experience documentation • CRISP-DM is flexible to account for differences • Different business/agency problems • Different data Source: Laura Squier
Phases and Tasks Business Understanding Data Understanding Data Preparation Modeling Deployment Evaluation Determine Business Objectives Background Business Objectives Business Success Criteria Situation Assessment Inventory of Resources Requirements, Assumptions, and Constraints Risks and Contingencies Terminology Costs and Benefits Determine Data Mining Goal Data Mining Goals Data Mining Success Criteria Produce Project Plan Project PlanInitial Asessment of Tools and Techniques Collect Initial Data Initial Data Collection Report Describe Data Data Description Report Explore Data Data Exploration Report Verify Data Quality Data Quality Report Data Set Data Set Description Select Data Rationale for Inclusion / Exclusion Clean Data Data Cleaning Report Construct Data Derived Attributes Generated Records Integrate Data Merged Data Format Data Reformatted Data Select Modeling Technique Modeling Technique Modeling Assumptions Generate Test Design Test Design Build Model Parameter Settings Models Model Description Assess Model Model AssessmentRevised Parameter Settings Evaluate Results Assessment of Data Mining Results w.r.t. Business Success Criteria Approved Models Review Process Review of Process Determine Next Steps List of Possible Actions Decision Plan Deployment Deployment Plan Plan Monitoring and Maintenance Monitoring and Maintenance Plan Produce Final Report Final Report Final Presentation Review Project Experience Documentation Source: Laura Squier
Phases in CRISP • Business Understanding • This initial phase focuses on understanding the project objectives and requirements from a business perspective, and then converting this knowledge into a data mining problem definition, and a preliminary plan designed to achieve the objectives. • Data Understanding • The data understanding phase starts with an initial data collection and proceeds with activities in order to get familiar with the data, to identify data quality problems, to discover first insights into the data, or to detect interesting subsets to form hypotheses for hidden information. • Data Preparation • The data preparation phase covers all activities to construct the final dataset (data that will be fed into the modeling tool(s)) from the initial raw data. Data preparation tasks are likely to be performed multiple times, and not in any prescribed order. Tasks include table, record, and attribute selection as well as transformation and cleaning of data for modeling tools. • Modeling • In this phase, various modeling techniques are selected and applied, and their parameters are calibrated to optimal values. Typically, there are several techniques for the same data mining problem type. Some techniques have specific requirements on the form of data. Therefore, stepping back to the data preparation phase is often needed. • Evaluation • At this stage in the project you have built a model (or models) that appears to have high quality, from a data analysis perspective. Before proceeding to final deployment of the model, it is important to more thoroughly evaluate the model, and review the steps executed to construct the model, to be certain it properly achieves the business objectives. A key objective is to determine if there is some important business issue that has not been sufficiently considered. At the end of this phase, a decision on the use of the data mining results should be reached. • Deployment • Creation of the model is generally not the end of the project. Even if the purpose of the model is to increase knowledge of the data, the knowledge gained will need to be organized and presented in a way that the customer can use it. Depending on the requirements, the deployment phase can be as simple as generating a report or as complex as implementing a repeatable data mining process. In many cases it will be the customer, not the data analyst, who will carry out the deployment steps. However, even if the analyst will not carry out the deployment effort it is important for the customer to understand up front what actions will need to be carried out in order to actually make use of the created models.
Phases in the DM Process: CRISP-DM Source: Laura Squier
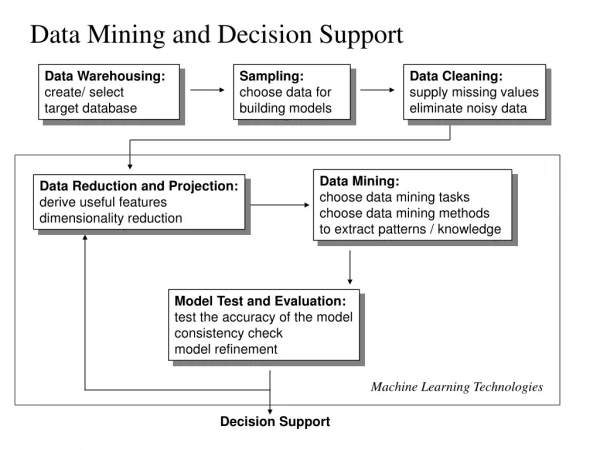
Business Understanding: Statement of Business Objective Statement of Data Mining objective Statement of Success Criteria Data Understanding Explore the data and verify the quality Find outliers Phases in the DM Process (1 & 2) Source: Laura Squier
Phases in the DM Process (3) • Data preparation: • Takes usually over 90% of our time • Collection • Assessment • Consolidation and Cleaning • table links, aggregation level, missing values, etc • Data selection • active role in ignoring non-contributory data? • outliers? • Use of samples • visualization tools • Transformations - create new variables Source: Laura Squier
Phases in the DM Process (4) • Model building • Selection of the modeling techniques is based upon the data mining objective • Modeling is an iterative process - different for supervised and unsupervised learning • May model for either description or prediction Source: Laura Squier
Prediction Models for Predicting and Classifying Regression algorithms (predict numeric outcome): neural networks, rule induction, CART (OLS regression, GLM) Classification algorithm predict symbolic outcome): CHAID, C5.0 (discriminant analysis, logistic regression) Descriptive Models for Grouping and Finding Associations Clustering/Grouping algorithms: K-means, Kohonen Association algorithms: apriori, GRI Types of Models Source: Laura Squier
Data Mining Algorithms • Market Basket Analysis • Memory-based reasoning • Cluster detection • Link analysis • Decision trees and rule induction algorithms • Neural Networks • Genetic algorithms
Neural Networks • Attempt to model neurons in the brain • Learn from a training set and then can be used to detect patterns inherent in that training set • Neural nets are effective when the data is shapeless and lacking any apparent patterns • May be hard to understand results
Neural Network Input layer Hidden layer Output Source: Laura Squier
Neural Networks • Description • Difficult interpretation • Tends to ‘overfit’ the data • Extensive amount of training time • A lot of data preparation • Works with all data types Source: Laura Squier
Decision trees and rule induction algorithms • Pulls rules out of a mass of data using classification and regression trees (CART) or Chi-Square automatic interaction detectors (CHAID) • These algorithms produce explicit rules, which make understanding the results simpler
Rule Induction • Description • Produces decision trees: • income < $40K • job > 5 yrs then good risk • job < 5 yrs then bad risk • income > $40K • high debt then bad risk • low debt then good risk • Or Rule Sets: • Rule #1 for good risk: • if income > $40K • if low debt • Rule #2 for good risk: • if income < $40K • if job > 5 years Source: Laura Squier
Rule Induction • Description • Intuitive output • Handles all forms of numeric data, as well as non-numeric (symbolic) data • C5 Algorithm a special case of rule induction • Target variable must be symbolic Source: Laura Squier
Apriori • Description • Seeks association rules in dataset • ‘Market basket’ analysis • Sequence discovery Source: Laura Squier