Download
1 / 23
230 likes | 418 Vues
PR/USVI COMT hurricane/storm selection criteria: significant impact on the region (surge and or waves) recent : remote data available (satellite , aircraft, radar ) data availability: winds ( meteo ) , waves, sea level and surge no hurricanes or storms with significant surge and wave data

E N D
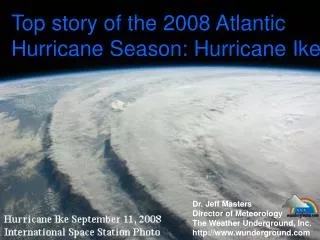
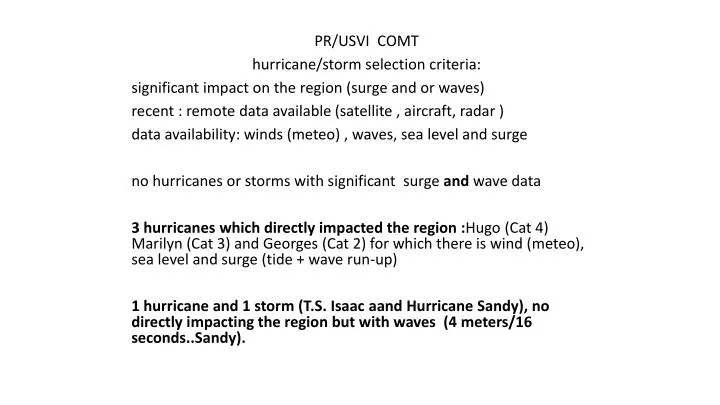
PR/USVI COMT hurricane/storm selection criteria: significant impact on the region (surge and or waves) recent : remote data available (satellite , aircraft, radar ) data availability: winds (meteo) , waves, sea level and surge no hurricanes or storms with significant surge and wave data 3 hurricanes which directly impacted the region :Hugo (Cat 4) Marilyn (Cat 3) and Georges (Cat 2) for which there is wind (meteo), sea level and surge (tide + wave run-up) 1 hurricane and 1 storm (T.S. Isaac aand Hurricane Sandy), no directly impacting the region but with waves (4 meters/16 seconds..Sandy).
Track of Selected Storms Marilyn 1995 Hugo 1989 Georges 1998 Lenny 1999 Isaac 2012 Sandy 2012 (out of area)
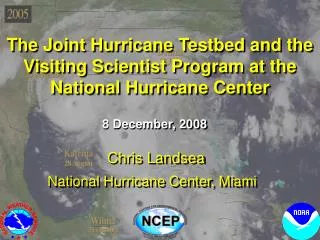
Historical meteorological data available from National Climatic Data Center http://gis.ncdc.noaa.gov/map/viewer/#app=cdo&cfg=cdo&theme=hourly&layers=1&node=gis • Hurricane Georges (1998) • Hurricane Hugo (1989) Hurricane Lenny (1999) • Hurricane Marilyn (1995)
HURRICANE HUGO All available maximum sustained wind data (estimated and observed from the report and the National Hurricane Center) for Hurricane Hugo indicates Hugo was a category 3 (Saffir-Simpson Scale) when it hit the Puerto Rican Islands of Vieques and Culebra. Hugo weakened to a category 2 hurricane when it affected the mainland of Puerto Rico. Hugo was a category 4 hurricane when it hit the Virgin Islands andSouth Carolina.
Hurricane Marilyn 104 mph winds in St Croix Surge (still water) + wave run-up Measurements of the storm surge (surge + waves?) by the U.S. Geological Survey (USGS) on St. Croix found most areas had heights of 5-6 feet, but there was one location on the north coast that was hit with a storm tide of 11.7 feet.
H/ Georges • Several land-based locations within the Caribbean recorded sustained hurricane-force winds during Georges passage including Hamilton Airport and VITEMA/Herman Hill in St. Croix, Cyril E. King Airport in St. Thomas, and all the official reporting sites in Puerto Rico. The highest sustained wind and gust reported at an official site was 78 knots and 93 knots, respectively, at Roosevelt Roads Naval Station (TJNR) at 2302 UTC 21 September.
CariCOOS Wave Data • NDBC Wave Data • There was a WaveRider Buoy (NDBC 41140, depth 244 m), operated by Scripps Institution of Oceanography, located in Christiansted Harbor in St. Croix. It has historical data from 2008-2010 so it has wave data for the following Hurricanes: • Hurricane Omar (2008) • Hurricane Earl (2010) • There is a NDBC deep water buoy (NDBC 41043, depth 5.3 km) located 170 nautical miles North-Northeast of San Juan. It has spectral wave data from 2007 until present, so there is data for the extra-tropical generated swells as well as for the following Hurricanes: • Hurricane Omar (2008) • Hurricane Earl (2010) • Hurricane Irene (2011) • Hurricane Isaac (2012) • Hurricane Sandy (2012) • There is a NDBC deep water buoy (NDBC 42060, depth 1.6 km) located 76 nautical miles South-Southwest of Plymouth, Montserrat. It has spectral wave data from 2009 until present, so there is data in the Caribbean Sea for the following Hurricanes: • Hurricane Earl (2010) • Hurricane Irene (2011) • Hurricane Isaac (2012) • Hurricane Sandy (2012) Ponce – Summer 2009 San Juan- Summer 2010 Rincon – December 2010 South of St. John – April 2011 South of St. Thomas – March 2013 Vieques – May 2011 CariCOOS Wind Data
Hurricane Sandy Rincon, PR San Juan, PR
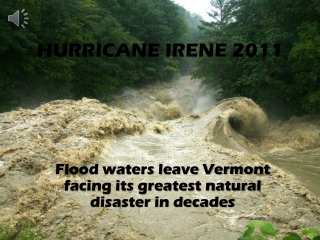
Rincon Extratropical Wave Experiment (Jan – Feb 2012) Puerto Rico is exposed to swells generated At the North Atlantic during October-March Due to its location, the town of Rincon is affected by most swells that range in direction from NorthWest to NorthEast As a consequence of the local bathymetry of Rincon, the wave field refracts (almost 90◦) and is focused towards the coast The Tres Palmas Marine Reserve has an exten- sive coverage of Elkhorn corals reef, and depths go from more than 100 m to 20 m directly into the reef area The refracted wave field comes close to perpendicular to the reef area
Instrument setup (1) DatawellWaverider (1) Nortek AWAC (2) Ocean Sensor Systems Pressure Sensor (1) Teledyne Sentinel ADCP Waverider(2D spectrum): 33 m, 30 min interval sampling AWAC (2D spectrum): 18 m, 30 min interval sampling (waves) ADCP had comm. problem Pressure Sensors: 6.54m, 3.33 m Continuous, 10 Hz sampling rate Sentinel ADCP: 10 m channel, 30 min interval sampling 0.5 m bin size
AWAC (18 m) PS #1 (6.5 m) PS #2 (3.3 m) January 14, 2013 Instruments right under the waves! ADCP on alongshore channel after waves break (to the left)
Wave energy dissipation and redistribution About 85% energy dissipation/redistribution over 200 m distance Max Hs (Waverider) 2.5 m, Highest wave zero-crossing 3.2 m