Download
1 / 1
10 likes | 175 Vues
B. A.

E N D
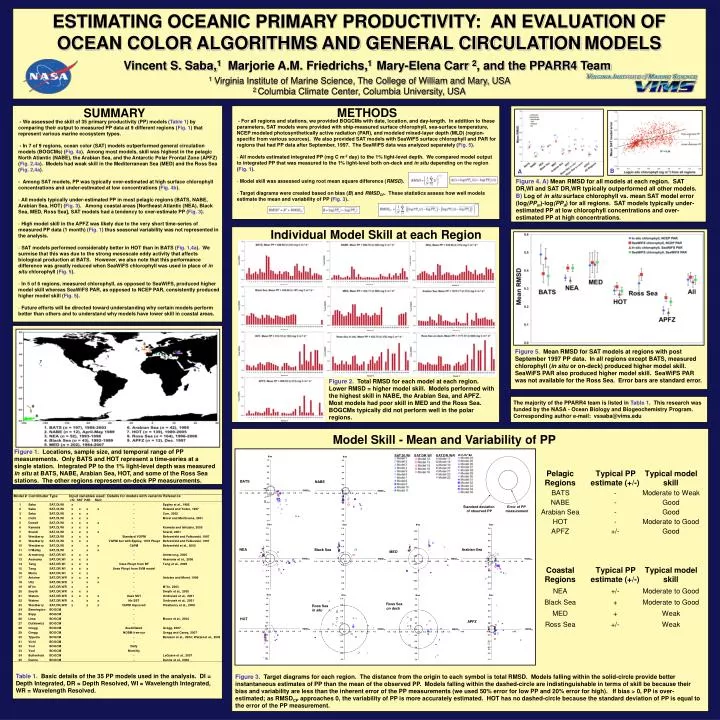
B A Figure 4. A) Mean RMSD for all models at each region. SAT DR,WI and SAT DR,WR typically outperformed all other models. B) Log of in situ surface chlorophyll vs. mean SAT model error (log(PPm)-log(PPd) for all regions. SAT models typically under-estimated PP at low chlorophyll concentrations and over-estimated PP at high concentrations. Individual Model Skill at each Region Figure 2. Total RMSD for each model at each region. Lower RMSD = higher model skill. Models performed with the highest skill in NABE, the Arabian Sea, and APFZ. Most models had poor skill in MED and the Ross Sea. BOGCMs typically did not perform well in the polar regions. The majority of the PPARR4 team is listed in Table 1. This research was funded by the NASA - Ocean Biology and Biogeochemistry Program. Corresponding author e-mail: vssaba@vims.edu SAT,DI,WI SAT,DR,WI SAT,DR,WR BOGCM Standard deviation of observed PP Error of PP measurement ESTIMATING OCEANIC PRIMARY PRODUCTIVITY: AN EVALUATION OF OCEAN COLOR ALGORITHMS AND GENERAL CIRCULATIONMODELS Vincent S. Saba,1 Marjorie A.M. Friedrichs,1 Mary-Elena Carr 2, and the PPARR4 Team 1 Virginia Institute of Marine Science, The College of William and Mary, USA 2 Columbia Climate Center, Columbia University, USA METHODS SUMMARY • - For all regions and stations, we provided BOGCMs with date, location, and day-length. In addition to these parameters, SAT models were provided with ship-measured surface chlorophyll, sea-surface temperature, NCEP modeled photosynthetically active radiation (PAR), and modeled mixed-layer depth (MLD) (region-specific from various sources). We also provided SAT models with SeaWiFS surface chlorophyll and PAR for regions that had PP data after September, 1997. The SeaWiFS data was analyzed separately (Fig. 5). • All models estimated integrated PP (mg C m-2 day) to the 1% light-level depth. We compared model output to integratedPP that was measured to the 1% light-level both on-deck and in situ depending on the region (Fig. 1). • Model skill was assessed using root mean square difference (RMSD). • Target diagrams were created based on bias (B) and RMSDCP. These statistics assess how well models estimate the mean and variability of PP (Fig. 3). • - We assessed the skill of 35 primary productivity (PP) models (Table 1) by comparing their output to measuredPP data at 9 different regions (Fig. 1) that represent various marine ecosystem types. • - In 7 of 9 regions, ocean color (SAT) models outperformed general circulation models (BOGCMs) (Fig. 4a). Among most models, skill was highest in the pelagic North Atlantic (NABE), the Arabian Sea, and the Antarctic Polar Frontal Zone (APFZ) (Fig. 2,4a). Models had weak skill in the Mediterranean Sea (MED) and the Ross Sea (Fig. 2,4a). • - Among SAT models, PP was typically over-estimated at high surface chlorophyll concentrations and under-estimated at low concentrations (Fig. 4b). • All models typically under-estimated PP in most pelagic regions (BATS, NABE, Arabian Sea, HOT) (Fig. 3). Among coastal areas [Northeast Atlantic (NEA), Black Sea, MED, Ross Sea], SAT models had a tendency to over-estimate PP (Fig. 3). • High model skill in the APFZ was likely due to the very short time-series of measured PP data (1 month) (Fig. 1) thus seasonal variability was not represented in the analysis. • SAT models performed considerably better in HOT than in BATS (Fig. 1,4a). We surmise that this was due to the strong mesoscale eddy activity that affects biological production at BATS. However, we also note that this performance difference was greatly reduced when SeaWiFS chlorophyll was used in place of in situ chlorophyll (Fig. 5). • In 5 of 6 regions, measured chlorophyll, as opposed to SeaWiFS, produced higher model skill whereas SeaWiFS PAR, as opposed to NCEP PAR, consistently produced higher model skill (Fig. 5). • Future efforts will be directed toward understanding why certain models perform better than others and to understand why models have lower skill in coastal areas. Figure 5. Mean RMSD for SAT models at regions with post September 1997 PP data. In all regions except BATS, measured chlorophyll (in situ or on-deck)produced higher model skill. SeaWiFS PAR also produced higher model skill. SeaWiFS PAR was not available for the Ross Sea. Error bars are standard error. Model Skill - Mean and Variability of PP Figure 1. Locations, sample size, and temporal range of PP measurements. Only BATS and HOT represent a time-series at a single station. Integrated PP to the 1% light-level depth was measured in situ at BATS, NABE, Arabian Sea, HOT, and some of the Ross Sea stations. The other regions represent on-deck PP measurements. Table 1. Basic details of the 35 PP models used in the analysis. DI = Depth Integrated, DR = Depth Resolved, WI = Wavelength Integrated, WR = Wavelength Resolved. Figure 3. Target diagrams for each region. The distance from the origin to each symbol is total RMSD. Models falling within the solid-circle provide better instantaneous estimates of PP than the mean of the observed PP. Models falling within the dashed-circle are indistinguishable in terms of skill be because their bias and variability are less than the inherent error of the PP measurements (we used 50% error for low PP and 20% error for high). If bias > 0, PP is over-estimated; as RMSDCP approaches 0, the variability of PP is more accurately estimated. HOT has no dashed-circle because the standard deviation of PP is equal to the error of the PP measurement.