Download
1 / 60
610 likes | 752 Vues
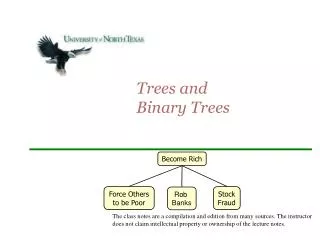
Trees and Cushions. Jack van Wijk Eindhoven University of Technology Treemap Workshop, May 31, 2001 HCIL, University of Maryland. InfoVis at Eindhoven. Started 1998 Focus: Trees and graphs Large data sets

E N D
Trees and Cushions Jack van Wijk Eindhoven University of Technology Treemap Workshop, May 31, 2001 HCIL, University of Maryland
InfoVis at Eindhoven • Started 1998 • Focus: • Trees and graphs • Large data sets • Use of computer graphics knowledge (textures, geometry, shading) to generate more effective visualizations
Trees (T) and Cushions (C) • T+C: Cushion treemaps (InfoVis’99) • T+C: Squarified treemaps (Vissym’00) • C: Voronoi diagrams (Vissym’01) • C: Enridged contour maps (Vis’01) • T: Botanical vis (InfoVis’01) • What next?
Cushion TreemapsVisualization of Hierarchical Information Jarke J. van Wijk Huub van de Wetering Eindhoven University of Technology IEEE InfoVis’99
Insight in structure of large trees • Why is my disk full? • What is our product portfolio? • How is this university organized? Fuzzy questions: Visualization needed
Treemap (Shneiderman, 1992) E1 C3 G2 A16 H4 F2 B3 C3 D10 I4 E1 F2 G2 I4 H4 Alternating directions, area represents size
How to emphasize structure? • Color? • Linewidth? • Nesting? • Shading? Use shaded geometric model!
Ridges Ridges for more insight Binary tree
+ = 2 z = ax + bx + cy + dy + e 2 Ridge + rotated ridge = cushion
level H = 0.75
level H = 0.50
Demo www.win.tue.nl/sequoiaview May 21 2001: 45,000 downloads
Squarified Treemaps Mark Bruls Kees Huizing Jarke J. van Wijk Eindhoven University of Technology Vissym’00, Amsterdam
Thin rectangles (small leaves high in hierarchy e.g., .cshrc) • hard to compare sizes • hard to point at • waste of pixels • inaccurate size
How to avoid thin rectangles? drop the single direction layout (emphasize structure by other means)
Squarification algorithm 1. Start placing recs in one row 2. stop when aspect ratio stops getting better 3. repeat with remaining area and recs Recursive per level (just like standard treemap algorithm)
6 6 6 6 6 6 4 3 4 6 6 6 etc. 6 2 2 1 3 4 6 6 Squarification algorithm 6 4 6 6 4 3 4/1 2 aspect ratio: 8/3 3/2 2 1 2 3 4 49/27 9/2 9/4 25/9
Result of squarification directory
Frames for structure • no maze running for the viewer • depth in structure as frame height • “remote cousins” are visibly separated by indent
Visualization of Generalized Voronoi Diagrams Alex Telea, Jarke van Wijk Vissym’01, Ascona
Cushions • Cushions help to understand hierarchical spatial tesselations of the plane • How about cushions to visualize Generalized Voronoi Diagrams?
Generalized Voronoi diagrams N = 1 N = 2 Polygon = area where N seeds are closest
Generalized Voronoi Diagrams • Many other types (different distance measures) • Applications
Enridged Contour Maps Van Wijk & Telea, Vis’01, San Diego • Given: Height field f(x,y) • Required: • Qualitative (where are the ridges) and • Quantitative (how high is this peak) info
Enridged height field ... height(f(x, y)) linear mapping non-linear mapping f(x, y)
Climate (January) Color: Temperature; Height: Precipitation
Climate (July) Color: Temperature; Height: Precipitation
Back to Trees:Botanical Visualization of Huge Hierarchies Ernst Kleiberg, Huub van de Wetering, Jarke van Wijk InfoVis’01, San Diego
Idea • Botanical trees are easy to understand, yet contain a lot of branches and leaves • Can we use ideas from botanical modeling for InfoVis?
Strand model (Holton, 1994) • Mimics vascular system • Each leaf is connected to one strand • Branch = bundle of strands • Rules define when a branch is split First try: • Each directory is a branch • Each file is a leaf