Download
1 / 30
300 likes | 471 Vues
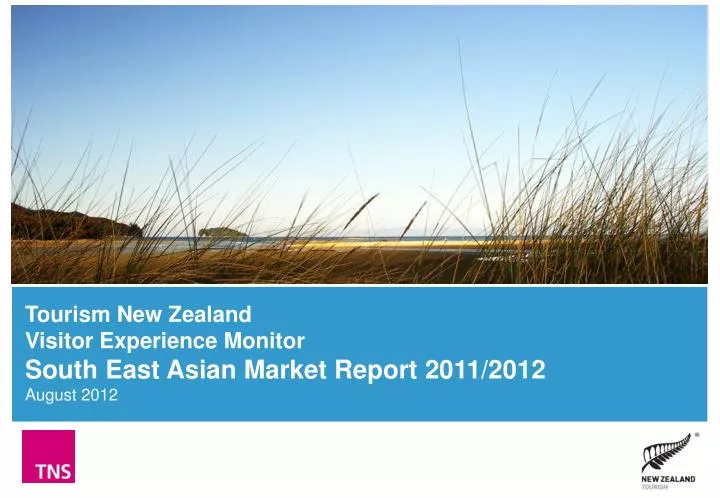
Tourism New Zealand Visitor Experience Monitor South East Asian Market Report 2011/2012 August 2012. Satisfaction amongst South East Asian visitors indicatively decreased last year, with almost a quarter not highly satisfied with their visit.

E N D
Tourism New ZealandVisitor Experience MonitorSouth East Asian Market Report 2011/2012August 2012
Satisfaction amongst South East Asian visitors indicatively decreased last year, with almost a quarter not highly satisfied with their visit Overall visitor satisfaction (South East Asian visitors to New Zealand) 2011/12 2010/11 2009/10 Overall Satisfaction with New Zealand Proportion Not Highly Satisfied with New Zealand(1) Proportion Very Likely to Recommend New Zealand(2) Proportion Likely to Recommend New Zealand(3) Notes: 1. Not highly satisfied is defined as those rating their overall visit to New Zealand 1 to 7 on a 10 point scale where 1 is ‘Not at all satisfied’ and 10 is ‘Extremely satisfied’; 2. Very likely to recommend is defined as those stating a 9 to 10 on a 10 point scale where 1 is ‘ not at all likely to recommend’ and 10 is ‘extremely likely to recommend’; 3. Likely to recommend is defined as those stating a 7 to 10 on a 10 point scale where 1 is ‘ not at all likely to recommend’ and 10 is ‘extremely likely to recommend’ Significantly higher than previous year Significantly lower than previous year
The Visitor Experience model highlights the impact that the various aspects of a trip to New Zealand have upon overall satisfaction, as well as how well certain aspects are performing ILLUSTRATIVE How to Interpret the Visitor Experience Model Impact that quality of facilities has on the visitors overall accommodation satisfaction Impacts are statistically determined through multiple linear regression Quality of facilities xx% x.x Accommodation xx% x.x Quality of service xx% x.x Visitors satisfaction of the price they paid for all accommodation Price of accommodation xx% x.x Food and Beverage xx% x.x Impact that Visitors rating of Accommodation has on their overall satisfaction Internal Transport xxx x.x Overall Satisfaction Activities xxx x.x i-SITEs xxx x.x X.X Overall rating of all food and beverage used within New Zealand Overall Visitor satisfaction, average score rated on a 10 point scale where 1 is ‘not at all satisfied’ and 10 is ‘extremely satisfied’ Environment xxx x.x Safety xxx x.x
South East Asian visitor satisfaction with accommodation decreased significantly last year, which contributed to the overall decrease as this is an area this market places importance on Overall visitor experience (South East Asian visitors to New Zealand, 2011/12)(1)(2) SEA markets All markets Accommodation 18%8.3 Food and Beverage 11%8.0 Internal Transport 5% 8.4 Overall Satisfaction 8.9 Activities 35%8.9 i-SITEs NCI8.7 Environment 21% 9.0 Safety 10%8.8 Overall Satisfaction Key Experience driver All markets impact All markets satisfaction Notes: 1. Sample size n = 4,566; 2. NCI stands for ‘No Current Impact’ Significantly higher than previous year Significantly lower than previous year
The South East Asian market continued to be heavy users of hotels, however more stayed at private homes at the expense of motels last year Accommodation types used while in New Zealand (% South East Asian visitors to New Zealand, 2011/12)(1)(2) Significantly higher than previous year Significantly lower than previous year
The decrease in overall accommodation satisfaction was driven both by the customer service and cost Visitor accommodation experience (South East Asian visitors to New Zealand, 2011/12)(1)(2) SEA markets All markets Quality of amenities and facilities 34%8.1 Overall Accommodation 8.3 Quality of services 30%8.2 Price of accommodation 36%7.8 Overall Accommodation Key Experience driver All markets impact All markets satisfaction Notes: 1. Sample size n = 4,566; 2. NCI stands for ‘No Current Impact’ Significantly higher than previous year Significantly lower than previous year
Again, cost is highlighted as the greatest accommodation pain point amongst the South East Asian market Visitor feedback about accommodation (South East Asian visitors to New Zealand, 2011/12)
Food and beverage satisfaction amongst the South East Asian market is well behind the overall average due to lower satisfaction with all aspects, and particularly low levels of satisfaction with the price Visitor food and beverage experience (South East Asian visitors to New Zealand, 2011/12)(1)(2) SEA markets All markets Quality of food and beverage 44% 8.1 Overall Food and Beverage 8.0 Quality of services 24%8.2 Price of food and beverage 32%7.1 Overall Food and Beverage Key Experience driver All markets impact All markets satisfaction Notes: 1. Sample size n = 4,566; 2. NCI stands for ‘No Current Impact’ Significantly higher than previous year Significantly lower than previous year
Price is the overwhelmingly strongest negative about the food and beverage experience for South East Asian visitors, although they are reasonably complementary about the quality of the food Visitor feedback about food and beverage (South East Asian visitors to New Zealand, 2011/12)
Rental and private cars remain the most frequently used types of transport, although last year saw fewer South East Asian visitors use coach tours Transportation used while in New Zealand (% South East Asian visitors to New Zealand, 2011/12)(1)(2) Significantly higher than previous year Significantly lower than previous year
South East Asian visitor satisfaction with transport is below the overall average, with the price an area of poor performance Visitor internal transport experience (South East Asian visitors to New Zealand, 2011/12)(1)(2) SEA markets All markets Comfort, safety and reliability 35% 8.4 Overall Internal Transport 8.4 Quality of services 33%8.4 Price of transport 31% 7.8 Overall Internal Transport Key Experience driver All markets impact All markets satisfaction Notes: 1. Sample size n = 4,566; 2. NCI stands for ‘No Current Impact’ Significantly higher than previous year Significantly lower than previous year
The positives South East Asian visitors experience when using transport are punctuality and safety Visitor feedback about transport (South East Asian visitors to New Zealand, 2011/12)
South East Asian visitors are much less satisfied with activities than other markets. Lower satisfaction with the quality of the actual activity is the main driver as this is the most important aspect of the experience Visitor activities experience (South East Asian visitors to New Zealand, 2011/12)(1)(2) SEA markets All markets Quality of the actual activity 48%8.6 Quality of services 19%8.4 Overall Activities 8.9 Price of the activities 10%7.7 Safety of the activities 23%8.6 Overall Activities Key Experience driver All markets impact All markets satisfaction Notes: 1. Sample size n = 4,566; 2. NCI stands for ‘No Current Impact’ Significantly higher than previous year Significantly lower than previous year
Natural scenery when participating in activities and staff are the two main positives South East Asian visitors see in the activities experience Visitor feedback about activities (South East Asian visitors to New Zealand, 2011/12)
Participation by South East Asian visitors in outdoor activities remains low, although interest is particularly high Interest and participation in outdoor activities (% South East Asian visitors to New Zealand, 2011/12)(1) Activities on the Land Activities on the Water Significantly higher than previous year Significantly lower than previous year
Fewer South East Asian visitors BungyJumped last year Interest and participation in extreme sports (% South East Asian visitors to New Zealand, 2011/12)(1) Significantly higher than previous year Significantly lower than previous year
Fewer South East Asian visitors ate out, visited historic buildings or gardens last year, although the Rugby World Cup had a positive impact on sporting event participation Interest and participation in city or town based activities (% South East Asian visitors to New Zealand, 2011/12)(1) Significantly higher than previous year Significantly lower than previous year
Despite high levels of interest, South East Asian visitors were much less likely to participate in country sightseeing activities Interest and participation in sightseeing in the country activities (% South East Asian visitors to New Zealand, 2011/12)(1) Significantly higher than previous year Significantly lower than previous year
Conversion of interest to participation in sightseeing on the water activities remains very low Interest and participation in sightseeing on the water activities (% South East Asian visitors to New Zealand, 2011/12)(1) Significantly higher than previous year Significantly lower than previous year
There was a large drop in the proportion of South East Asian visitors who participated in a Maori Cultural performance Interest and participation in Maori Cultural and country based activities (% South East Asian Visitors to New Zealand, 2011/12)(1) Cultural Activities Involving Maori Other Activities in the Country Other Sightseeing or Activities Significantly higher than previous year Significantly lower than previous year
Fewer South East Asian visitors used i-SITEs last year Usage of i-SITEs (% South East Asian Visitors to New Zealand) All visitors 56% 44% 41% Significantly higher than previous year Significantly lower than previous year
Fewer South East Asian visitors used i-SITEs to make bookings How the i-SITE was used (% South East Asian i-SITE users) (1) (2) (3) All visitors 45% 55% 56% 37% 29% 28% 16% 13% 13% 2% 2% 3% Significantly higher than previous year Significantly lower than previous year
The decreasing number of users and changing use patterns hasn’t impacted South East Asian visitor satisfaction with i-SITEs, however this remains much lower than other markets Visitor i-SITEs experience (South East Asian i-SITE users, 2011/12)(1)(2) SEA markets All markets i-SITE facilities 16%8.7 How well the staff meet your needs 24% 8.5 Level of personal service 18%8.6 Overall i-SITEs 8.7 Knowledgeable staff 16% 8.6 Amount of planning 14%8.6 Ease of making bookings 7%8.8 Quality of recommended providers 6%8.5 Overall i-SITEs Satisfaction Key Experience driver All markets impact All markets satisfaction Notes: 1. Sample size n = 4,566; 2. NCI stands for ‘No Current Impact’ Significantly higher than previous year Significantly lower than previous year
Satisfaction with staff remains both a positive and negative of the i-SITE experience for South East Asian visitors, reflecting inconsistent delivery Visitor feedback about i-SITEs (South East Asian visitors to New Zealand, 2011/12)
The environment remains the most satisfying aspect of the entire New Zealand experience for South East Asian visitors Visitor environment experience (South East Asian visitors to New Zealand, 2011/12)(1)(2) SEA markets All markets NZ being clean and unpolluted 20%9.3 Un-crowded spaces 7%9.1 Natural landscapes and scenery 22% 9.5 Overall Environment 9.0 Weather 9%7.7 Roads and driving experience 18%8.1 Vibrant urban atmosphere 23%8.2 Overall Environment Key Experience driver All markets impact All markets satisfaction Notes: 1. Sample size n = 4,566; 2. NCI stands for ‘No Current Impact’ Significantly higher than previous year Significantly lower than previous year
Expectations about what to expect with the climate could be better communicated to the South East Asian market Visitor feedback about the environment (South East Asian visitors to New Zealand, 2011/12)
South East Asian visitors remain less satisfied with safety than other markets, driven by personal safety and the safety standard of activities Visitor safety experience (South East Asian visitors to New Zealand 2011/12)(1)(2) SEA markets All markets Personal safety in urban areas 32%8.6 Personal safety in country areas 25% 8.8 Overall Safety 8.8 Safety standards of activities 20% 8.7 Road safety 23%8.2 Overall Safety Key Experience driver All markets impact All markets satisfaction Notes: 1. Sample size n = 4,566; 2. NCI stands for ‘No Current Impact’ Significantly higher than previous year Significantly lower than previous year
The urban environment and road are the main negatives about safety in New Zealand for South East Asian visitors Visitor feedback about safety (South East Asian visitors to New Zealand, 2011/12)
South East Asian visitors are less likely to set their mobile phone to roaming and are more likely to purchase a sim card whilst in New Zealand Usage of technology in New Zealand (% South East Asian visitors to New Zealand, 2011/12)(1) Significantly higher than previous year Significantly lower than previous year
Travel guides are heavily influential sources of information both before and after arrival in New Zealand Information sources used when planning and booking a holiday in New Zealand (% South East Asian visitors to New Zealand, 2011/12)(1) Information Sources Used Before Arrival in New Zealand(2) Information Sources Used After Arrival in New Zealand(2)