Download
1 / 21
210 likes | 443 Vues
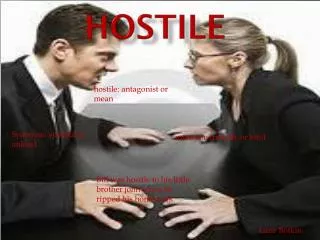
Hostile and Pre-Operational Surveillance. Mike Moll Protective Security Advisor, DHS. Do Terrorist Cells exist in the U.S.?. --Yes? --No?? Maybe?? . Real World Examples. --Middle-Eastern individual asking “suspicious questions” at a large chemical facility

E N D
Hostile and Pre-Operational Surveillance Mike Moll Protective Security Advisor, DHS
Do Terrorist Cells exist in the U.S.? • --Yes? • --No?? • Maybe??
Real World Examples • --Middle-Eastern individual asking “suspicious questions” at a large chemical facility • --White Male and Female engage in Suspicious Surveillance photography/videotaping of large chemical facility • --Two middle-eastern males taking pictures at a school bus garage • --Three middle-eastern males walk into a hospital in Michigan and ask, “Where are the children kept?” and “Where are the Muslims?” • --Three middle-eastern males driving up to a nuclear plant at a high rate of speed, doing a “Chinese Fire-Drill”, yelling “Allah Akbar” and leaving at a high rate of speed….
How do you mitigate Terrorism? • --Can you??? • --Yes • --Financially • --Understand CIKR Vulnerability • --Raise the vigilance level of the American Public • --Teach timely and accurate reporting • --Focus on training at the pre-primary levels and continue on through to the High School years
Enhanced Critical Infrastructure Protection (ECIP) Facility Dashboard November 2009
Infrastructure Survey Tool (IST) • Development Began in June 2008 • Pilot (Summer 2008) • Version 1 (Fall 2008) • Version 2 (Summer 2009) • Web-based Tool Collects Data • Streamlines data collection • Oracle back end database • Supports analysis and Dashboard • Major Principles • Simply a survey of existing protective measures in place at the facility • Gathers data at the weakest point for any particular protective measure (e.g., the shortest part of the fence or the one gate with the single lock) • Resulting Protective Measures Index (PMI) is calculated using the relative importance assigned to each protective measure attribute by a team of subject matter experts 6
Protective Measures Index (PMI) - Review • Based on Six “Level 1 Components” • Physical Security • Security Management • Security Force • Information Sharing • Protective Measures Assessment • Dependencies • Each of these components is based on “Level 2 Components” • Level 2 Components are, in turn, based on the most detailed asset characteristics, which are “Level 3 Components” for the facility (at the weakest point) 7
For Example, There Are 9 Physical Security Level 2 Components: • Fences • Gates • Closed circuit television (CCTV) • Intrusion detection systems (IDS) • Parking • Access control • Security lighting • Vehicle access control • Building envelope 9
FPMI = f (z1, z2, ..., zn) = bi * zi n Σ i = 1 Level 3 Components Affect Vulnerability (Fences Example) Fence Protective Measures Index = f (fraction enclosed, type, height, base anchored, other fence characteristics) (Note: the equation may take on a different form) • FPMI is a protective measures index of fence security going from 0 (less secure) to 100 (more secure), the zi represent specific levels of achievement for the factors that increase fence security (e.g., height, type, characteristics), and the bi are scaling constants (weights) that specify the relative importance of the factors. Additional information can be found at Constructing Vulnerability and Protective Measures Indices for the Enhanced Critical Infrastructure Protection Program by R.E. Fisher, W.A. Buehring, et al., October 1, 2009. 10
Fences PMI Example • 7-foot aluminum chain-link fence • Anchored base • Outriggers, 45 degree • Barbed wire • Clear zone, free of objects • Wood fence • 6-foot height • Partial clear zone Fence Protective Measures Index = 60 Fence Protective Measures Index = 13 11
Comparing Facility and Subsector Subsector Maximum Facility PMI Subsector Average Overall Facility PMI Subsector Minimum 12
Dashboard – Overall Tab “Overall” tab shows the overall facility PMI and the PMIs for each major component (Level 1) of the facility PMI (blue bar) and the low, average, and high PMI for the subsector (dots). Touch on the bar or dots to see the exact PMI figures. 13
Dashboard – Component Screens Tabs – Level 1 Level 3 Data Level 2 Components • Overall PMI Bar • Level 1 PMI Bar • Level 2 PMI Dial Level 3 Component PMI 14
Dashboard Interpretation • The Dashboard is a way to display facility-specific information obtained through the ECIP • Shows the PMI calculations for each component of the IST • PMI has a constructive sense in that it increases (gets better) as protective measures are added • The Dashboard shows the difference between the individual facility’s specific PMI and the average PMI for other like facilities (usually the critical infrastructure subsector) • The product should not give the impression that the subsector average PMIs are indicative of desired or adequate performance 15
Dashboard Interpretation (cont’d) • The Dashboard draws attention to components that are well below or well above the subsector average and may deserve additional study. • There may be very good reasons why a facility has a component PMI that is below subsector average. • Example: An urban facility where parking is allowed on the street would result in a low standoff number; no additional facility action may be possible • May just note the vulnerability and consider other protective measures enhancements (e.g., additional CCTV along the facility street-side to identify suspicious vehicles) • Each facility is different and will mitigate vulnerabilities and implement protective measures based on an individualized assessment of risks taking into consideration threat, assets to be protected, and facility characteristics. 16
Dashboard is a Tool • The Dashboard is simply a tool, and the PMI is simply a reflection of existing protective measures at the facility, not a definitive determination of facility vulnerability. • DHS is not advocating that any particular protective measures be installed/utilized at a facility based solely on the relative impact to the facility’s PMI reflected in the scenario element of the Dashboard. • It is recognized that not all protective measures are appropriate at every facility. Therefore, simply raising the PMI for a section in the Dashboard is not necessarily directly correlated to a reduction in vulnerability for a particular facility unless it is an appropriate measure that is properly integrated with the facility’s current security posture and effectively implemented. 17
How Do You Receive an IST? --Based on CIKR Thresholds --Contact Me to Arrange --Takes at least 4 to 6 hours --Need Security Director, IT, Facilities at a minimum --Facility owner/operator will get a look prior to submission --All information is protected from FOIA/Sunshine, etc…
Mike MollProtective Security Advisor616-454-5243 Work616-283-8772 Cellmichael.e.moll1@dhs.gov